
I’ve watched too many integrators lose a full day on a remote tower because they couldn’t read the real signal data from their 4G camera. That frustration is avoidable.
Most industrial 4G PTZ cameras8 let you check real-time RSRP, RSRQ, and SINR through the supplier’s built-in web interface, AT command terminal, or companion mobile app. The key is knowing where to look and which value matters most for stable video streaming.
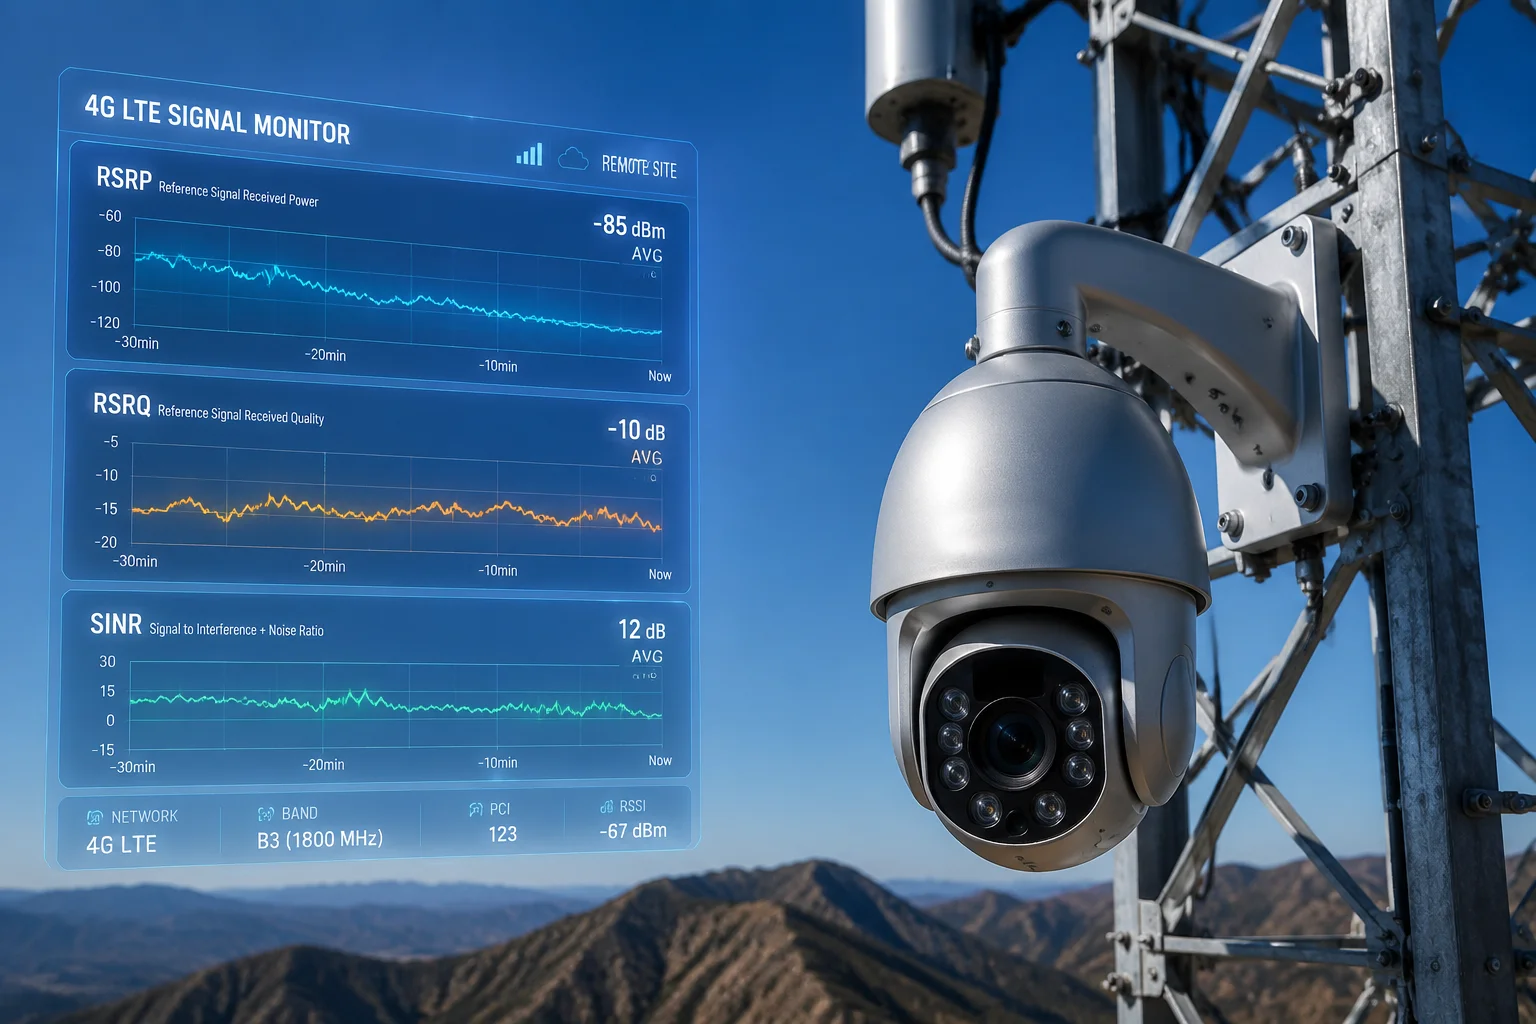 4G PTZ camera signal diagnostics RSRP RSRQ SINR
Below, I break down the exact steps for each method. I also explain how to read the numbers, spot interference, and log data over time. If you deploy 4G cameras in off-grid sites, this guide will save you hours of guesswork.
Table of Contents
Can I View the Exact dBm Signal Levels Directly from the Camera’s Mobile Dashboard?
Most integrators I talk to assume the camera only shows signal bars. That assumption costs them a truck roll when the stream drops at 2 AM.
Yes, most professional-grade 4G PTZ cameras display exact dBm values for RSRP, RSRQ, and SINR on a diagnostic page inside the web interface. You typically find it under Configuration > System > System Maintenance > Log/Status, in the “Cellular Status” section.
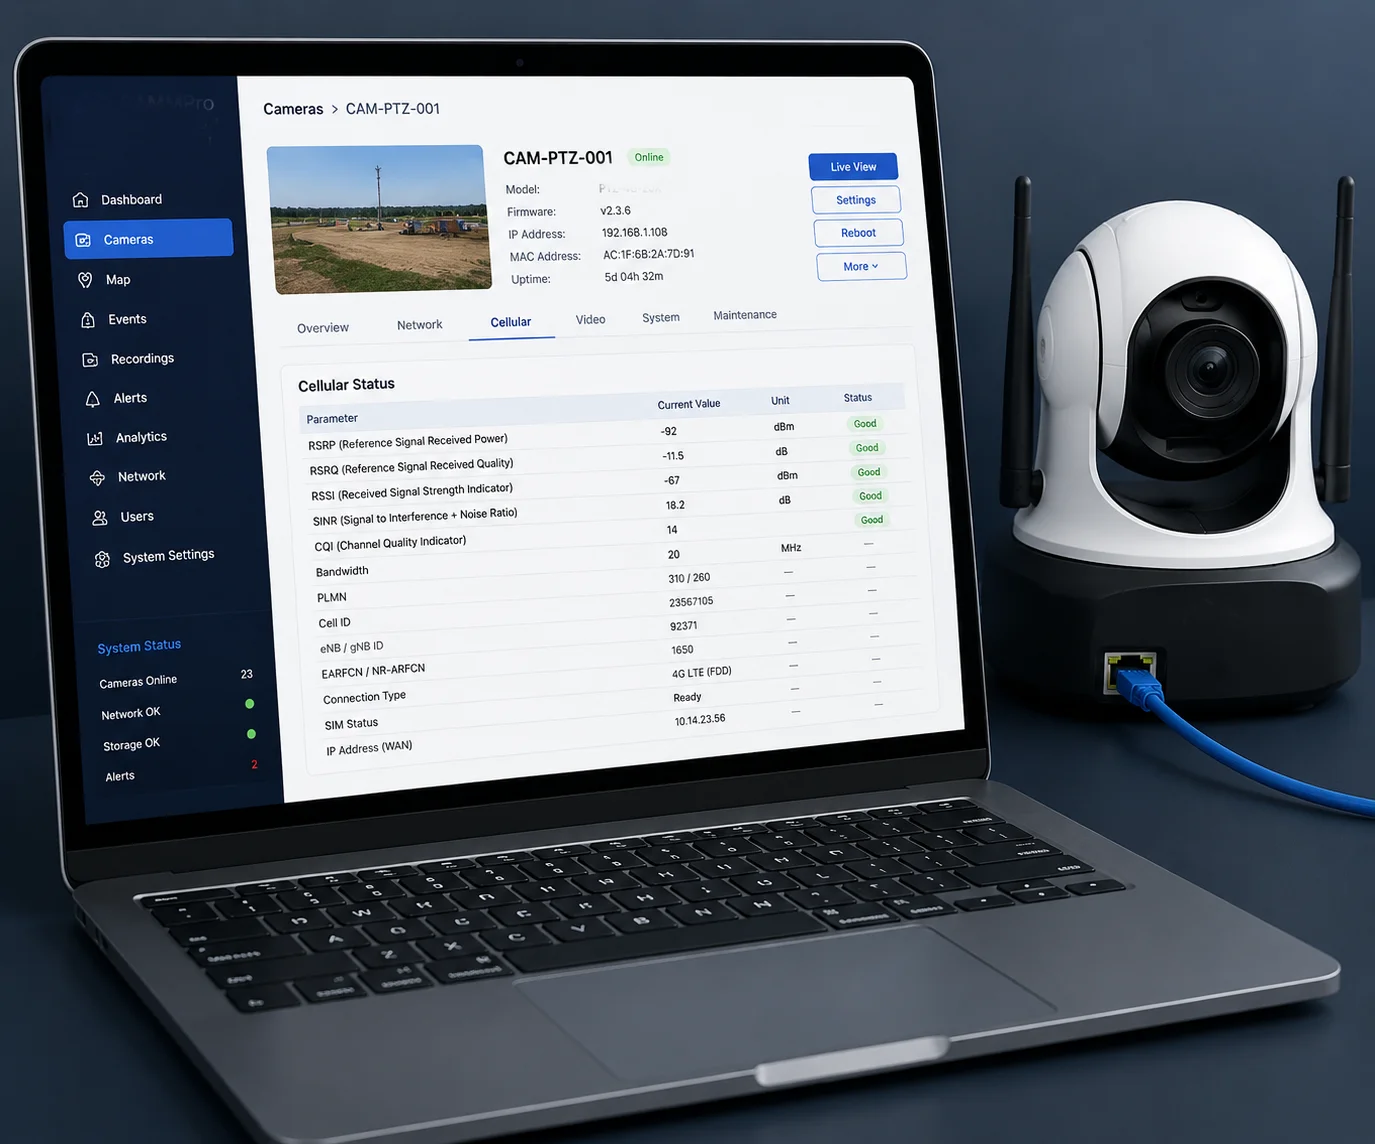 4G camera web interface showing RSRP dBm signal levels
Where Exactly Is the Diagnostic Page?
The path varies by firmware version. But the logic is the same across most industrial cameras. You log into the camera’s IP address through a browser. Then you navigate to the system or maintenance section. Look for a tab labeled “Network Status,” “Cellular Info,” or “Diagnostic.”
On our Loyalty-Secu 4G PTZ cameras, the path is:
Login > Configuration > System > System Maintenance > Log/Status > Cellular Status
Once you open that page, the system polls the 4G module every few seconds. It then displays the live values in a simple table. No extra software needed. No third-party tools.
What Do the Numbers Mean?
Here is a quick reference table. Print it out and keep it in your install kit.
| Parameter | What It Measures | Good Range | Poor Range |
|---|---|---|---|
| RSRP | Signal strength from the tower | $-70$ to $-90$ dBm | Below $-100$ dBm |
| RSRQ | Signal quality (accounts for noise and load) | $-3$ to $-10$ dB | Below $-15$ dB |
| SINR | Signal-to-interference-plus-noise ratio | Above $10$ dB | Below $3$ dB |
A common mistake is to only check RSRP. RSRP tells you how strong the signal is. But it does not tell you how clean the signal is. You can have a strong signal that is full of noise. That is why SINR matters more for video.
Why “Bars” Are Not Enough
Signal bars on a dashboard are a simplified summary. They usually map to RSRP alone. A camera might show 3 out of 4 bars, but the SINR could be $2$ dB. At that level, your 1080p stream will buffer, freeze, or drop entirely.
I always tell our clients: ignore the bars. Go straight to the numbers. If your supplier’s interface only shows bars and hides the raw data, that is a red flag. It means the software is designed for consumers, not for professionals who need to troubleshoot in the field.
What If the Page Is Hidden?
Some firmware versions hide the diagnostic page behind an “Advanced” toggle. Try appending /diag.html or /status.html to the camera’s IP address in your browser. If that does not work, ask your supplier for the direct URL. Any serious manufacturer will give it to you.
Does the Software Provide a “Signal Quality Score” to Help with Site Positioning?
You are standing at the base of a pole in the middle of a Texas ranch. You need to know if this spot will hold a stable stream before you bolt the camera up there. A single number would help.
Some suppliers offer a composite “Signal Quality Score” in their software, but most professional-grade cameras display raw RSRP, RSRQ, and SINR separately. This is actually better because a single score hides the root cause of problems.
 Signal quality score vs raw RSRP RSRQ SINR data comparison
Why Raw Values Beat a Single Score
A combined score is convenient. But it is like a doctor telling you “your health is 7 out of 10” without telling you your blood pressure or heart rate. You cannot act on it.
When you see the raw values, you can diagnose the exact problem. For example:
- RSRP is good, SINR is bad: You have strong signal but heavy interference. Rotate the antenna or lock a different band.
- RSRP is bad, SINR is good: The tower is far away, but the environment is clean. Add an external high-gain antenna.
- Both are bad: This location may not support 4G video. Consider relocating or adding a signal repeater.
Using AT Commands for Expert-Level Data
If your camera’s web interface only shows a simplified score or just bars, you can bypass it entirely. Most industrial 4G cameras use a Quectel module2 or SIMCom module inside. These modules accept AT commands.
Here is how to do it:
- Open the camera’s web interface.
- Navigate to Network > Advanced > AT Command (if available).
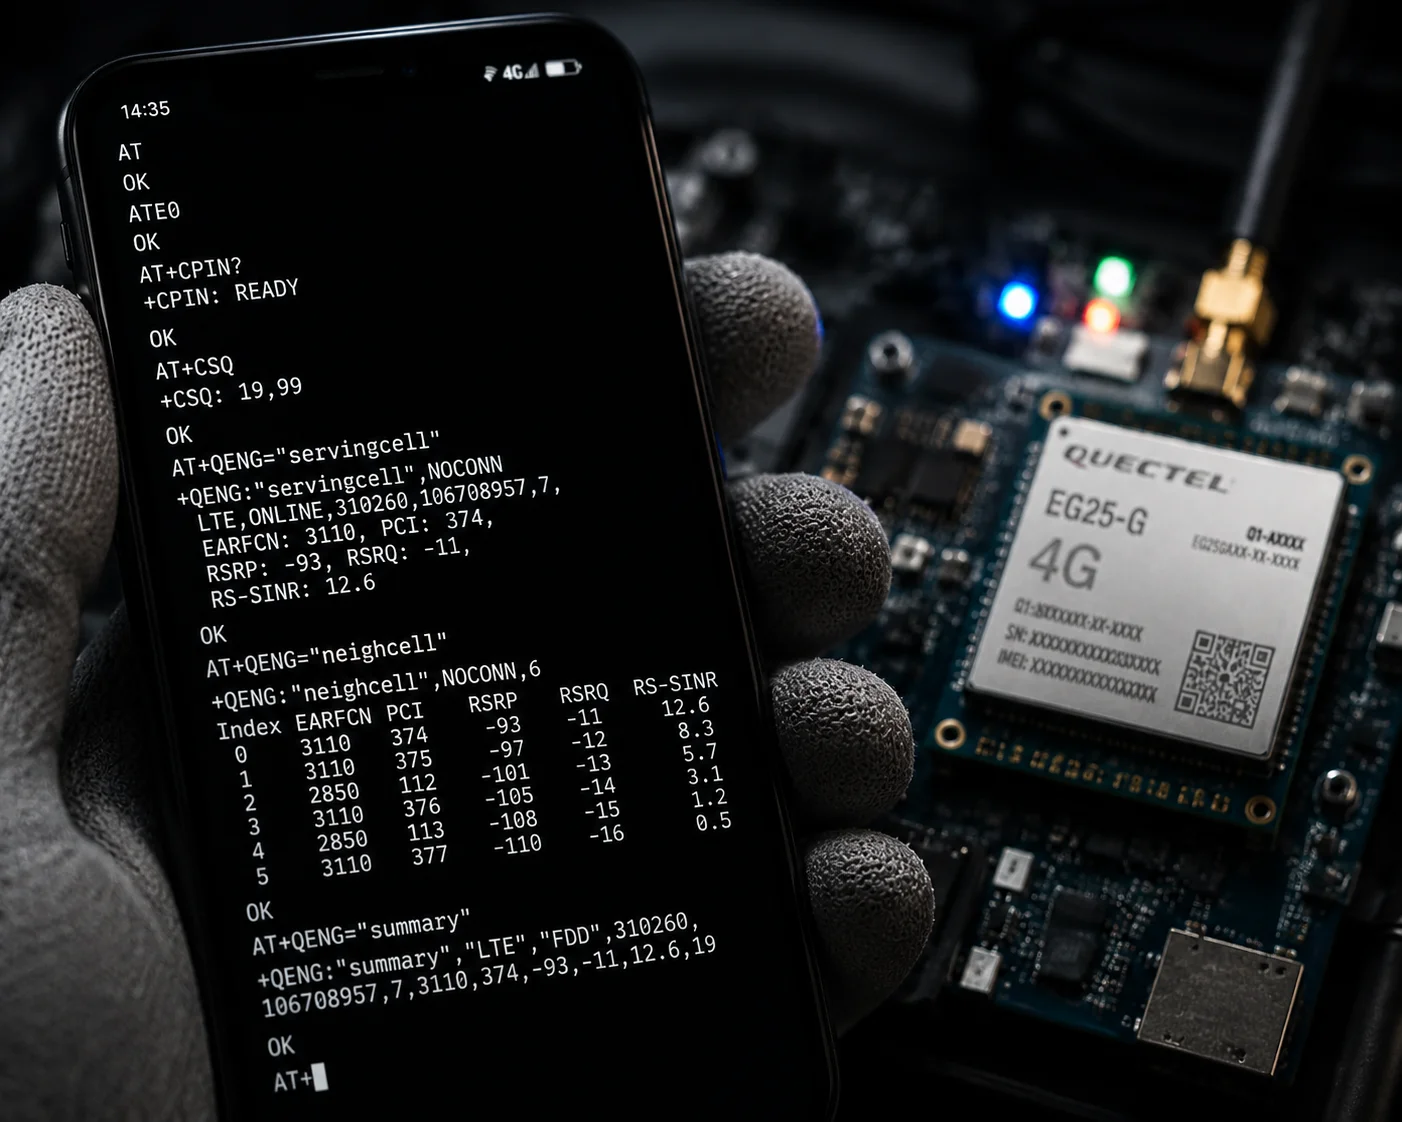
- Type AT+QENG=”servingcell”3 for Quectel modules.
- Click Send.
The module returns a string like this:
+QENG: "servingcell","NOCONN","LTE","FDD",310,410,1A2B3C,456,1234,13,5,5,1A2B,-95,-12,75,15How to Parse the AT Command Response
The string looks intimidating. But you only need the last few values.
| Position in String | Value in Example | Parameter |
|---|---|---|
| 4th from last | $-95$ | RSRP (dBm) |
| 3rd from last | $-12$ | RSRQ (dB) |
| Last | $15$ | SINR (dB) |
In this example, RSRP of $-95$ dBm is acceptable. RSRQ of $-12$ dB is moderate. SINR of $15$ dB is good. This site would support a stable 1080p stream.
When to Use AT Commands vs. the Web Dashboard
Use the web dashboard for routine checks. Use AT commands when:
- The dashboard only shows bars or a simplified score.
- You suspect the dashboard is caching old data (some interfaces update slowly).
- You need to check the
serving cell ID6, band number, or PCI for advanced troubleshooting. - You are comparing data between two different cameras at the same site.
AT commands give you unbuffered, real-time data straight from the module. There is no delay, no rounding, and no simplification. For a field engineer, this is the ground truth.
How Do I Interpret the SINR Values to Determine If Local Interference Is the Problem?
I have seen integrators swap out perfectly good cameras three times before realizing the problem was electromagnetic interference from a nearby transformer. The camera was fine. The environment was not.
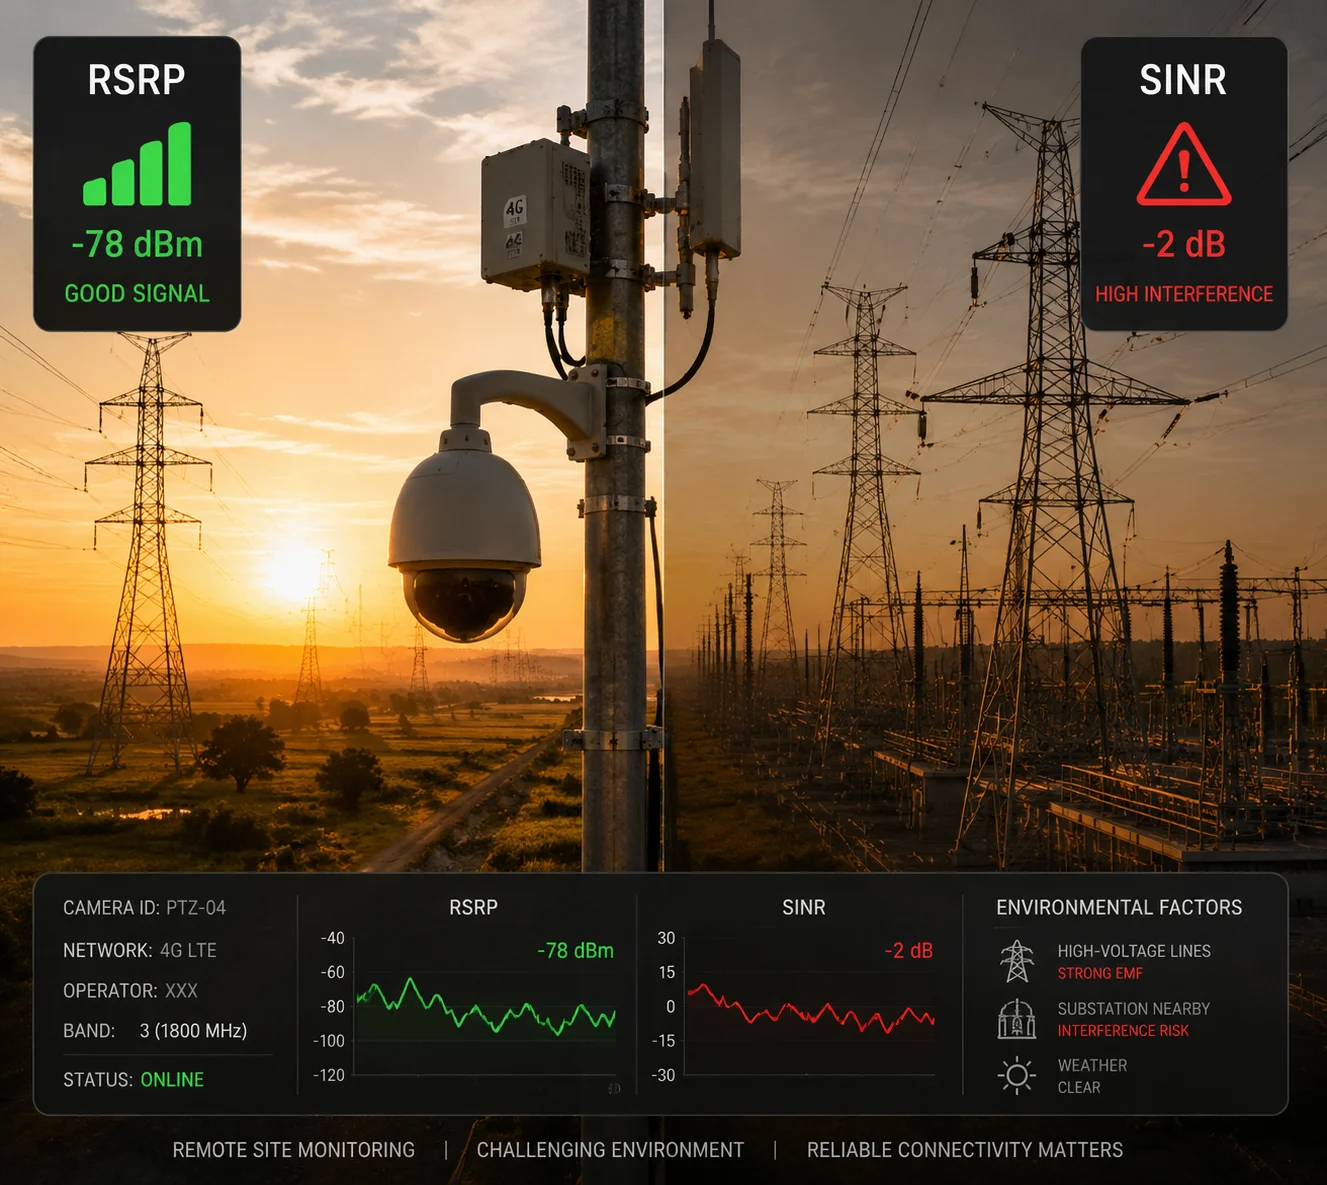
[SINR (Signal-to-Interference-plus-Noise Ratio)](https://en.wikipedia.org/wiki/Signal-to-interference-plus-noise_ratio)1 directly measures how much interference is affecting your signal. If your SINR is below $5$ dB while RSRP is above $-90$ dBm, local interference is almost certainly the cause of your streaming issues.
 SINR value interpretation for 4G camera interference diagnosis
SINR Is Your Interference Detector
Think of SINR as a ratio. It compares the strength of the signal you want (from the cell tower) to the strength of everything you do not want (noise, interference from power lines, other radio equipment).
- SINR above $20$ dB: Excellent. You can run 4K streams without worry.
- SINR between $10$ and $20$ dB: Good. 1080p streaming will be stable.
- SINR between $3$ and $10$ dB: Marginal. Expect occasional buffering or frame drops.
- SINR below $3$ dB: Poor. The interference is overwhelming the signal. Video will be unreliable.
The High-Voltage Tower Trap
David, this one is for you and anyone deploying near power infrastructure in Texas or similar environments.
Near high-voltage towers, RSRP often looks great. The cell tower might be close. You see $-80$ dBm and think the site is perfect. But the high-voltage lines create broadband electromagnetic interference. This interference crushes your SINR down to $0$ dB or even negative values.
The fix is not a stronger antenna. The fix is to reduce interference pickup. Here is what I recommend:
Step-by-Step SINR Optimization
- Check SINR in the diagnostic page. If it is below $10$ dB, proceed to step 2.
- Slowly rotate the 4G antenna. Watch the SINR value in real time. Even a 15-degree rotation can improve SINR by $5$–$8$ dB because you are changing the antenna’s orientation relative to the interference source.
- Lock a low-frequency band4: In the camera’s network settings, manually select Band 13 (700 MHz) or Band 71 (600 MHz). Low-frequency bands are more robust against local interference.
- Check cable shielding. If you use an external antenna with a coaxial cable, make sure the cable has proper shielding (double-shielded RG6 minimum). A poorly shielded cable acts like an interference antenna.
SINR vs. RSRP: Which One Decides Video Quality?
| Scenario | RSRP | SINR | Video Result |
|---|---|---|---|
| Strong signal, clean environment | $-75$ dBm | $18$ dB | Smooth 1080p/4K |
| Strong signal, heavy interference | $-80$ dBm | $2$ dB | Constant buffering, drops |
| Weak signal, clean environment | $-105$ dBm | $14$ dB | Stable 720p, possible 1080p |
| Weak signal, heavy interference | $-110$ dBm | $-1$ dB | No usable video |
The table makes it clear. SINR controls whether your video stream survives. RSRP controls the maximum throughput. But without clean SINR, high RSRP is useless for real-time video.
A Practical Field Test
Before you blame the camera hardware, do this. Take a phone with the same carrier SIM card (for example, Verizon). Install CellMapper5 or Network Cell Info Lite. Hold the phone at the camera’s mounting height. Compare the phone’s SINR to the camera’s SINR.
If the phone shows SINR of $15$ dB but the camera shows $4$ dB at the same spot, the problem is not the environment. The problem is the camera’s antenna installation, cable routing, or connector quality. That narrows your troubleshooting from “everything” to “antenna system.”
Can the Camera Log Signal Fluctuations over a 24-Hour Period for Network Analysis?
You install the camera. The stream looks fine at 2 PM. But your client calls at 6 AM saying the feed is dead. Without historical data, you are flying blind.
Yes, many industrial 4G PTZ cameras can log RSRP, RSRQ, and SINR values over time. This data is stored in the system log or exported as a CSV file export7 for analysis, letting you identify patterns like peak-hour congestion or time-specific interference.
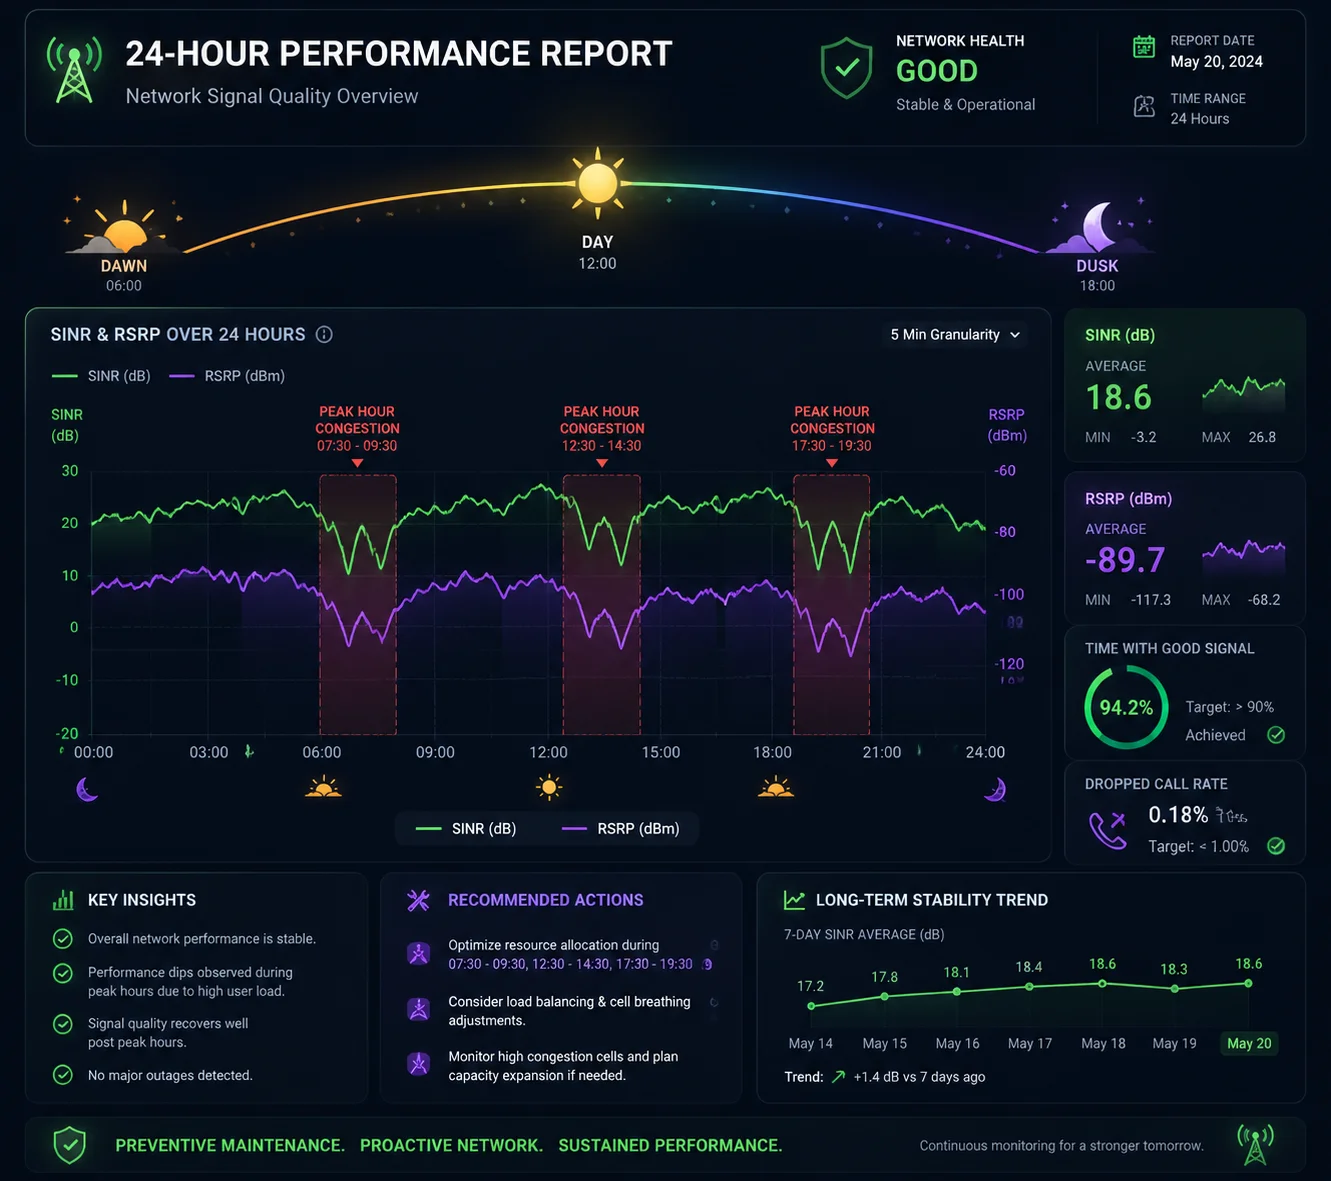 24-hour signal log RSRP SINR fluctuation analysis
Why 24-Hour Logging Matters
Cell tower performance is not constant. It changes throughout the day. During morning and evening rush hours, more people use the network. The tower gets congested. Your camera’s RSRQ drops because the tower is serving more users. Your SINR may also drop if nearby devices create more radio noise.
Without a 24-hour log, you only see a snapshot. A snapshot at 2 PM might show perfect numbers. But the real problem happens at 7 AM when the local workforce starts streaming music and checking emails on the same tower.
How to Enable Logging
On most industrial cameras, logging is not enabled by default. You need to turn it on manually.
- Go to Configuration > System > System Maintenance > Log Settings.
- Enable “Network Diagnostic Log” or “Cellular Performance Log.”
- Set the polling interval. I recommend every 5 minutes for a detailed picture without filling up storage too fast.
- Set the log retention period. Most cameras can store 7 to 30 days of data.
- Export the log as a CSV file for analysis.
What to Look for in the Log
Once you have 24 hours of data, open the CSV in Excel or Google Sheets. Create a simple line chart with time on the X-axis and SINR on the Y-axis. Look for these patterns:
- Regular dips at the same time every day: This is tower congestion. The fix is to lock a less popular band or switch to a carrier with less traffic in that area.
- Random spikes and drops: This is intermittent interference. Check for nearby equipment that cycles on and off (generators, pumps, industrial motors).
- Steady decline over hours: This could be a thermal issue with the 4G module. As the camera heats up in direct sun, the module’s performance can degrade. Check if the camera has proper ventilation or a heat sink.
- Sudden drop to zero followed by recovery: The module is losing registration and re-attaching to the network. This could be a SIM issue, a weak signal causing handover failures, or a firmware bug.
Sharing the Log with Your Carrier
Here is a tip that saves time. If you suspect the problem is on the carrier’s side (tower maintenance, congestion, or a faulty sector), export the 24-hour log and send it to your carrier’s enterprise support team. Include the serving cell ID (from the AT command output) and the exact GPS coordinates of your camera.
Carriers take data seriously. A CSV file with timestamped SINR drops is far more effective than calling and saying “the signal is bad sometimes.” It turns a vague complaint into an actionable engineering ticket.
Using the Log for Preventive Maintenance
I recommend pulling the signal log once a month for every remote camera in your fleet. Compare it to the baseline you recorded during installation. If SINR has dropped by more than $5$ dB over three months, something has changed. Maybe a new building went up near the tower. Maybe the carrier re-aimed a sector antenna. Maybe your camera’s antenna connector is corroding.
Catching these trends early prevents emergency truck rolls. And in off-grid sites where a truck roll costs $500 or more, that monthly log check pays for itself many times over.
Conclusion
Check SINR first, use AT commands for raw data, and log signals over 24 hours. These three steps will solve most 4G camera connectivity problems before they become expensive site visits.
1. Wikipedia definition of SINR, crucial for wireless link quality. ↩︎ 2. Quectel’s official site for cellular modules used in industrial IoT. ↩︎ 3. Quectel AT command reference for serving cell information. ↩︎ 4. Wikipedia list of LTE frequency bands; explains how lower bands offer better interference robustness. ↩︎ 5. CellMapper is a crowd-sourced cellular tower mapping tool for field diagnostics. ↩︎ 6. Wikipedia article explaining cell identity in cellular networks. ↩︎ 7. Wikipedia description of CSV format, useful for exporting signal logs. ↩︎ 8. Wikipedia article on PTZ cameras, pan-tilt-zoom functionality. ↩︎