
I’ve seen 4G modules burn out on job sites because nobody checked the antenna VSWR before shipping. That one skipped test cost my client thousands.
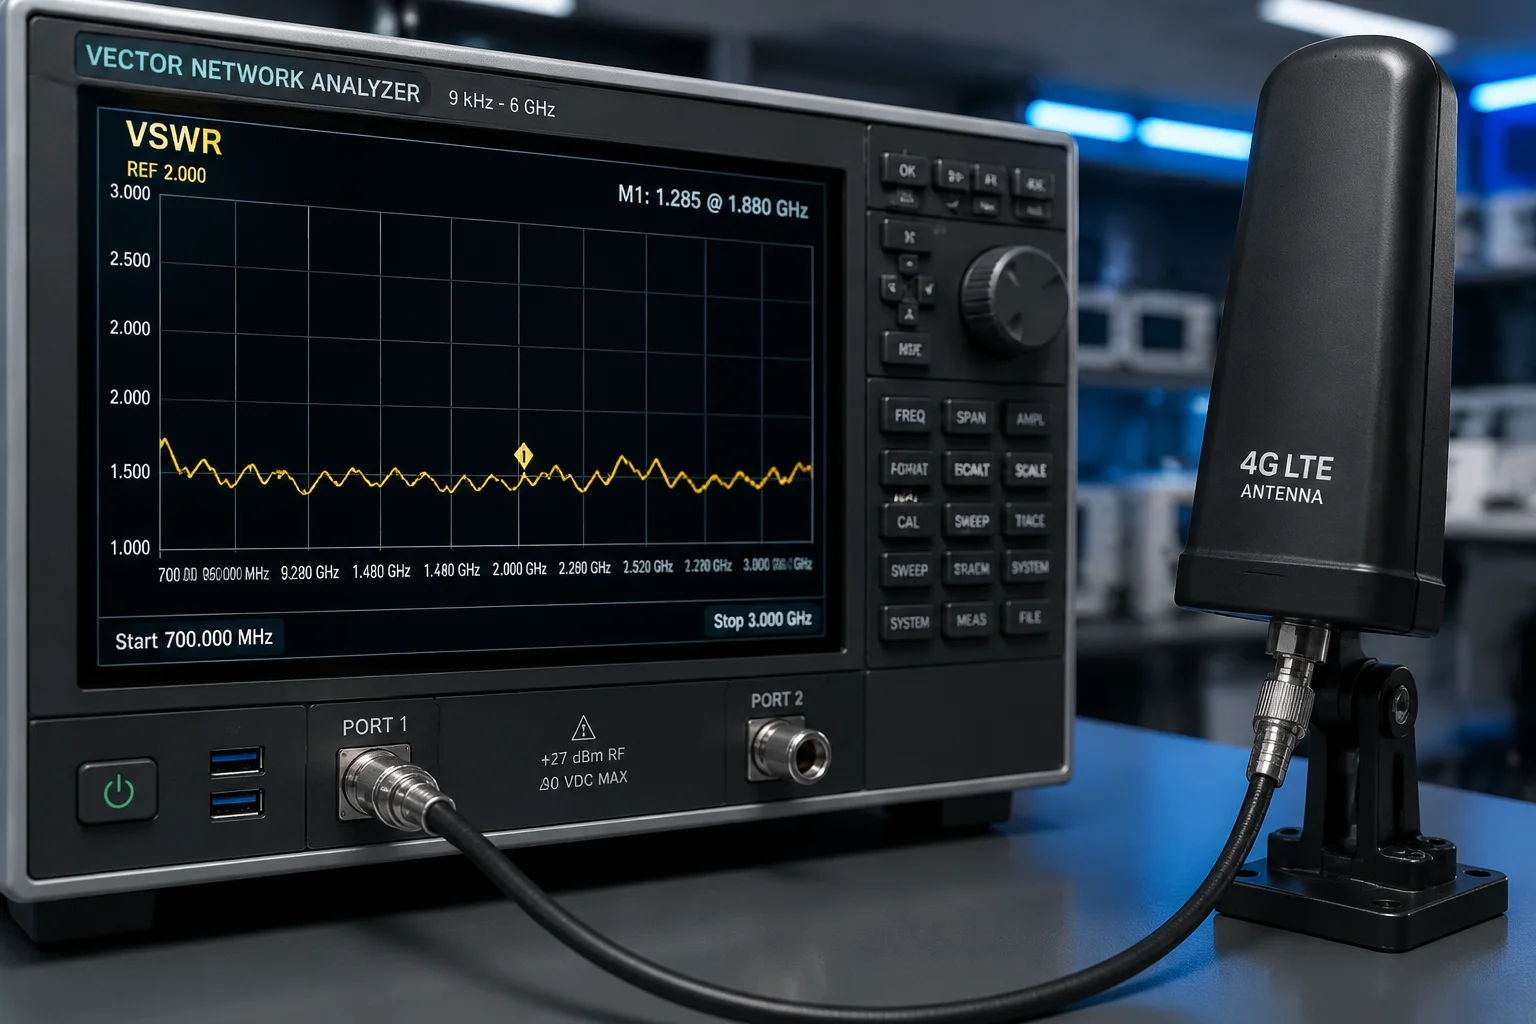
To test if your antenna’s VSWR is below the 1.5 industrial standard, you need a Vector Network Analyzer (VNA), a proper OSL calibration, and a clean test environment free from metal interference. The VNA sends a sweep signal into the antenna, measures reflected energy, and converts it into a VSWR value. Any reading below 1.5 means less than 4% power is reflected — that is the benchmark for industrial-grade 4G LTE antennas.
 VSWR testing antenna industrial standard
Below, I will walk you through the exact testing process we use at our factory, answer the most common questions from our B2B clients, and share the expert checklist that keeps our rejection rate near zero. Whether you are sourcing antennas for Verizon B131 or T-Mobile B712 deployments, this guide will help you verify quality before a single unit leaves the dock.
Table of Contents
Will a High VSWR (Voltage Standing Wave Ratio) Damage My 4G Module Over Time?
I get this question from almost every new client. They buy cheap antennas, deploy them on remote solar camera sites, and six months later the 4G module is dead. The repair truck costs more than the camera.
Yes, a high VSWR will damage your 4G module over time. When VSWR exceeds 2.0, more than 11% of transmitted power reflects back into the module. This reflected energy turns into heat. Over weeks and months, that heat degrades internal components, shortens the module’s lifespan, and can eventually cause a complete failure — especially in sealed outdoor enclosures with no active cooling.
 high VSWR damage 4G module
How Reflected Power Destroys Hardware
Think of it this way. Your 4G module pushes out RF energy. If the antenna is well-matched (VSWR below 1.5), almost all that energy leaves the antenna and travels through the air. But if the antenna is poorly matched, a chunk of that energy bounces back. The module’s power amplifier (PA) has to absorb it. The PA was not designed to handle its own output coming back at it.
Here is what happens step by step:
- The PA heats up beyond its design limit.
- Thermal cycling stresses solder joints on the module’s PCB.
- Over time, micro-cracks form.
- One hot day, the module fails.
This is not theory. I have seen it happen on construction site cameras in Arizona and farm monitoring systems in Texas. The ambient temperature is already 45°C inside the housing. Add reflected power heat, and you are cooking the module.
The Numbers Behind the Damage
| VSWR Value | Reflected Power (%) | Risk Level | What Happens Over 12 Months |
|---|---|---|---|
| 1.0 (perfect) | 0% | None | Module runs cool, full lifespan |
| 1.5 | 4% | Low | No measurable degradation |
| 2.0 | 11% | Medium | PA runs warm, lifespan reduced ~20% |
| 3.0 | 25% | High | Frequent overheating, module may fail within 6–9 months |
| 5.0+ | 44%+ | Critical | Module failure likely within weeks |
Our Built-In Protection
At Loyalty-Secu, our 4G solar PTZ cameras include a firmware-level safety net. If the antenna’s VSWR spikes — say, because a bird bent the whip antenna or a connector got water inside — the module triggers power back-off3. It reduces transmit power automatically to protect itself. At the same time, it sends a network anomaly log to your backend system. You will know something is wrong before the module dies.
This does not replace good antenna selection. It is a last line of defense. The first line is always testing VSWR before you ship.
What About “Self-Healing” Modules?
Some suppliers claim their modules can handle high VSWR indefinitely. Be careful with that claim. Most commercial 4G modules (Quectel4, SIMCom, Sierra Wireless) specify a maximum antenna VSWR of 2.0 in their datasheets. Go above that, and you void the module warranty. No firmware trick changes the physics of heat dissipation.
If David or any of our clients asks me whether to spend an extra $0.50 per unit on a properly tuned antenna, my answer is always the same: that $0.50 saves you a $300 truck roll and a $45 module replacement. Every single time.
Can I Request a Smith Chart Report for the Specific Antennas Provided With My Order?
Many of my clients are engineers. They do not just want a pass/fail sticker. They want raw data. They want to see the Smith Chart and make their own judgment.
Yes, you can and should request a Smith Chart report for the specific antennas included in your order. A Smith Chart shows the antenna’s impedance at every frequency point across the band. It tells you not just whether the VSWR is below 1.5, but why — and what would happen if the operating frequency shifts slightly. At Loyalty-Secu, we provide Smith Chart data and S11 plots as part of our standard QC documentation for OEM/ODM antenna orders.
 Smith Chart antenna report
What a Smith Chart Actually Tells You
A VSWR number is a summary. A Smith Chart5 is the full story. It plots the antenna’s complex impedance (resistance + reactance) on a circular graph. The center of the chart is 50 ohms — the perfect match. The closer your data points sit to the center, the better your antenna performs.
Here is why this matters for B2B buyers:
- Frequency drift detection. If the impedance curve passes through the center at 698 MHz but drifts away at 716 MHz, you know the antenna is narrowband. It might pass a single-frequency VSWR test but fail in real-world use across the full B13 band (746–787 MHz).
- Tuning potential. If the impedance loop is close to the center but slightly off, a small matching network (a capacitor or inductor) can fix it. If the loop is far away, the antenna design itself is flawed. No amount of matching will save it.
- Batch consistency. By comparing Smith Charts from batch to batch, you can spot manufacturing drift early — before it becomes a field failure.
What to Look for in the Report
When you receive a Smith Chart report from your supplier, check these things:
| Check Item | What to Look For | Red Flag |
|---|---|---|
| Center clustering | Data points near 50Ω center at target frequencies | Points scattered near the chart edge |
| Frequency markers | Clear markers at band edges (e.g., 746 and 787 MHz for B13) | No frequency labels on the plot |
| Sweep range | Full band coverage, not just center frequency | Only one frequency point tested |
| Cable de-embedding | Report states calibration was done at antenna connector | No mention of calibration method |
| Sample size | At least 3–5 units per batch tested | Only 1 unit tested from a 10,000-piece order |
How We Handle This at Loyalty-Secu
For every OEM antenna order, our RF engineer runs a full S11 sweep on sample units from the production batch. We export the data in Touchstone (.s1p) format6 so your engineering team can open it in any RF simulation tool — whether that is HFSS7, CST, or even the free Smith Chart app on a laptop. We also generate a PDF summary with VSWR curves and Smith Chart screenshots, marked with your target frequency bands.
If you need testing on the full assembled unit — antenna mounted on the camera body with the cable connected — we do that too. Because as I will explain in the next section, the metal housing changes everything.
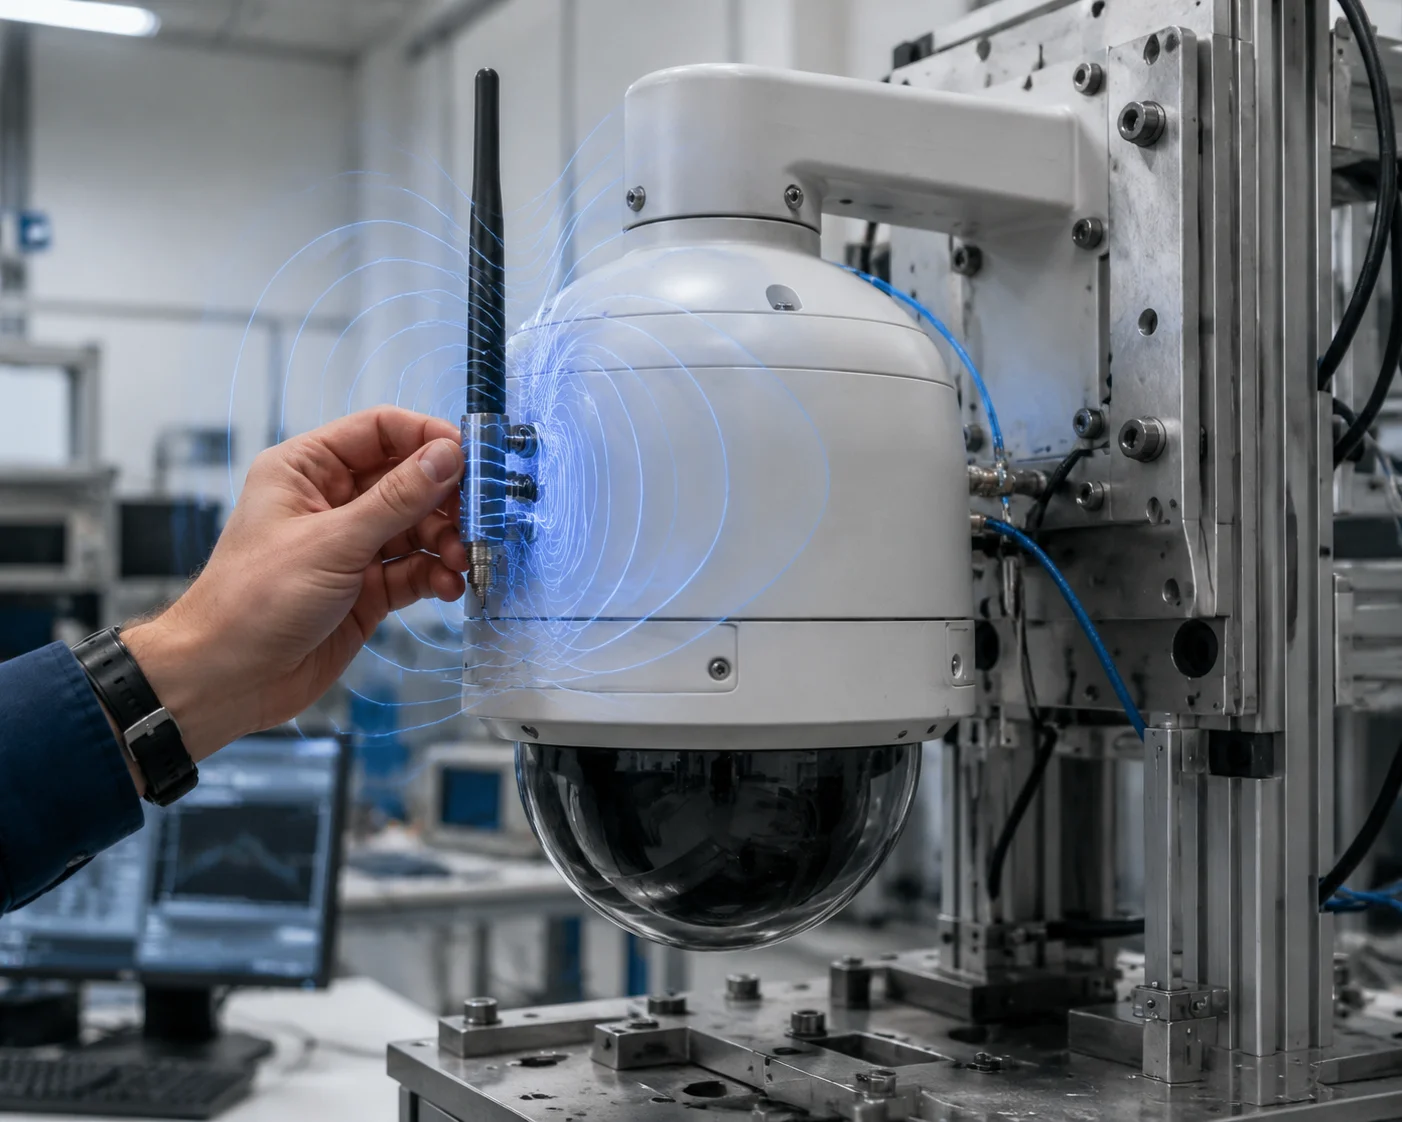
How Does the VSWR Change if the Antenna Is Mounted Close to the Camera’s Metal Body?
This is the question that separates experienced integrators from first-time buyers. On paper, the antenna spec sheet says VSWR 1.3. But once you bolt it onto a steel PTZ housing, that number can jump to 2.5 or worse.
The VSWR changes significantly when an antenna is mounted close to a camera’s metal body. Metal surfaces reflect and absorb RF energy, which shifts the antenna’s impedance away from the ideal 50 ohms. In practice, mounting a 4G antenna within 5 cm of a steel housing can increase VSWR by 0.5 to 1.5 points, depending on frequency, antenna type, and ground plane geometry. This is why antenna tuning must be done on the final assembled product — not on the bare antenna alone.
 antenna VSWR metal body camera
Why Metal Changes Everything
An antenna does not work in isolation. It interacts with everything around it. The metal body of a PTZ camera acts as a reflector and a partial ground plane8. This changes the antenna’s radiation pattern and its input impedance.
Here is a simple way to understand it. Imagine you are shouting in an open field. Your voice travels freely in all directions. Now imagine you are shouting next to a concrete wall. The echo changes how your voice sounds and how far it carries. The same thing happens to RF energy near metal.
The Three Main Effects
1. Impedance detuning. The antenna was designed to be 50 ohms at 700 MHz in free space. Place it 2 cm from a steel bracket, and the impedance might shift to 35 + j15 ohms. That mismatch shows up as higher VSWR.
2. Pattern distortion. The metal body blocks RF energy in some directions and reflects it in others. Your “omnidirectional” antenna is no longer omnidirectional. This does not show up in a VSWR test, but it affects real-world coverage.
3. Coupling and current flow. If the antenna touches the metal body or is very close to it, RF currents flow on the housing surface. The housing becomes part of the antenna — an unintended, uncontrolled part. This is unpredictable and hard to fix after the fact.
What We Do Differently
At Loyalty-Secu, we do not test antennas in free space and call it done. Our standard process includes what we call installed-state testing:
- The antenna is mounted on the actual camera housing.
- The cable is routed exactly as it will be in the field.
- The VNA measurement is taken at the module’s antenna port, not at the antenna connector.
This gives us the true system VSWR — the number that actually matters for your deployment.
Practical Mounting Guidelines
Based on hundreds of tests across our product line, here are the rules we follow:
- Whip antennas: Mount at least 10 cm from the nearest metal surface. Use a right-angle bracket if needed.
- PCB antennas (internal): Require a dedicated keep-out zone on the PCB — no copper pour within 8 mm of the antenna element.
- Magnetic mount antennas: These are designed to sit on metal. The metal roof or plate acts as the ground plane. But the plate must be at least 20 cm × 20 cm for low-band frequencies (600–900 MHz) to work properly.
If your project requires the antenna to be very close to the housing — for example, inside a dome — we offer custom-tuned antennas. Our RF team adjusts the matching network specifically for your enclosure geometry. That is the advantage of working with a manufacturer that controls the full vertical supply chain, from the PCB layout to the final assembly.
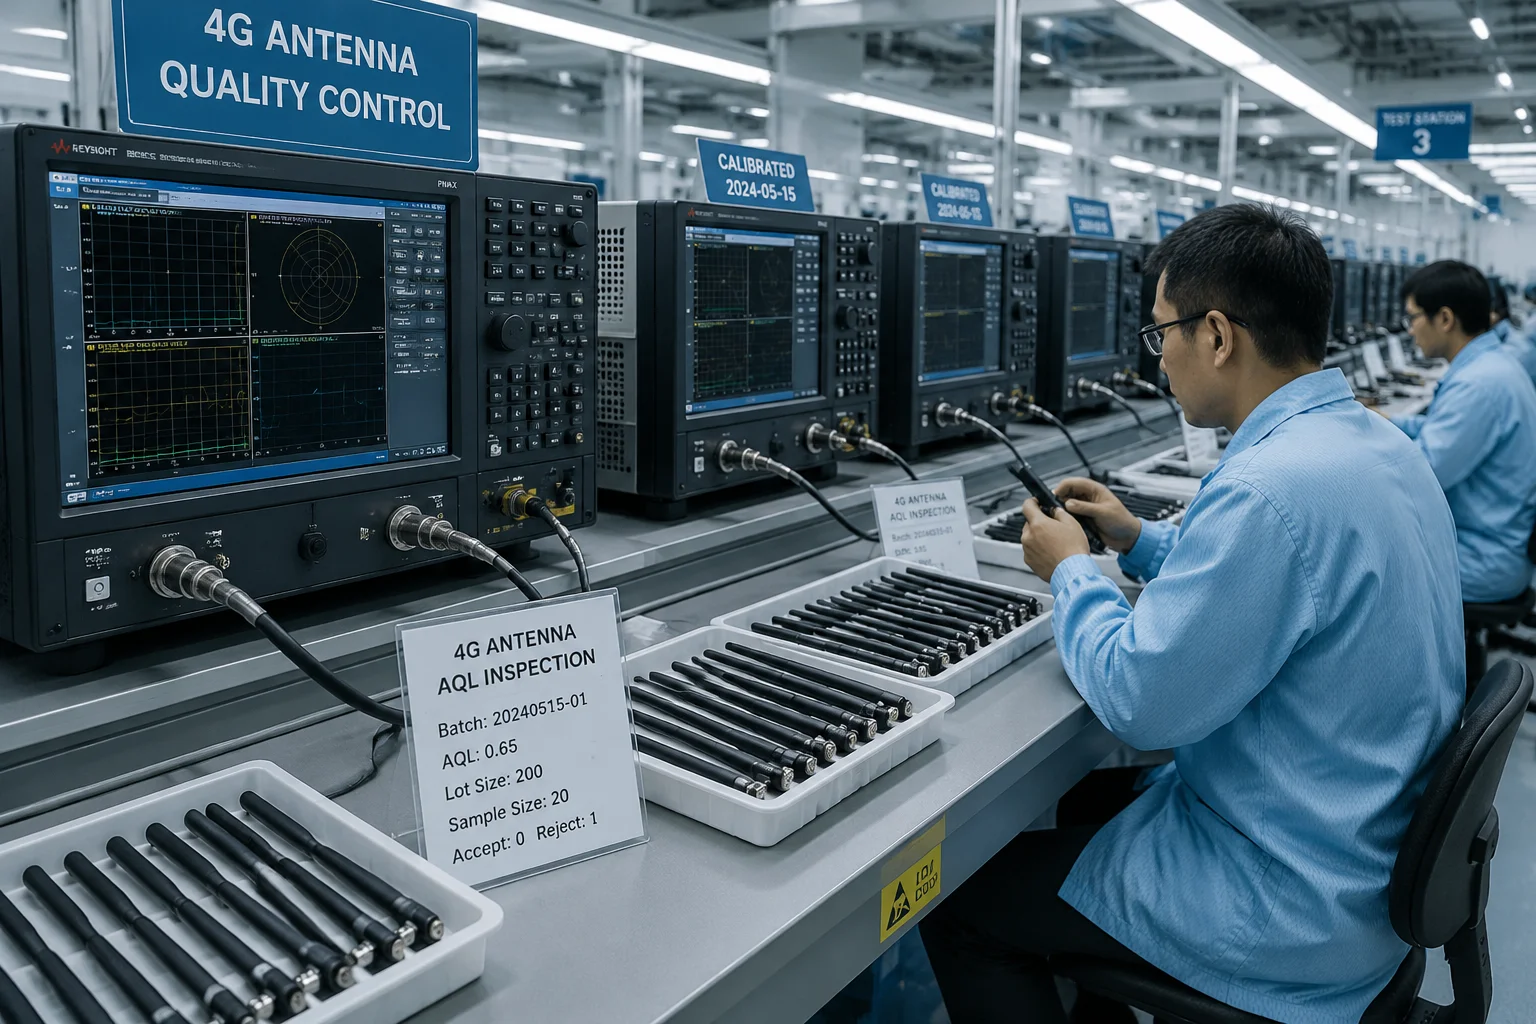
Does the Factory Verify the VSWR for Every Batch of Custom-Tuned 4G Antennas?
You have approved the sample. The VSWR was perfect at 1.2. But now 5,000 units are on the production line. How do you know batch number 47 is as good as the sample you tested three months ago?
A responsible factory verifies VSWR on a sampling basis for every production batch, and provides test reports with each shipment. At Loyalty-Secu, we follow AQL (Acceptable Quality Level) sampling per ISO 2859-1. For custom-tuned 4G antennas, we pull samples from the beginning, middle, and end of each batch run and test them on a calibrated VNA. Every batch ships with an S11 test report showing VSWR across the target frequency bands.
 factory VSWR batch testing antenna
Why Batch Testing Is Non-Negotiable
Antenna performance depends on tiny physical details. The length of a trace on a PCB. The gap between the radiating element and the ground plane. The dielectric constant of the plastic housing material. Any small change in materials or process can shift the resonant frequency and spike the VSWR.
Here are real-world causes of batch-to-batch variation that I have seen in this industry:
- PCB substrate change. The supplier switched from FR4 with Dk 4.3 to a cheaper batch with Dk 4.6. The antenna’s center frequency dropped by 15 MHz. VSWR at the target band went from 1.3 to 2.1.
- Solder paste thickness. A thicker solder layer on the antenna feed point changed the impedance by a few ohms. Enough to push VSWR above 1.5 on the low band.
- Plastic housing material. A new batch of ABS housing had a slightly different filler ratio. The near-field dielectric loading shifted the antenna tuning.
None of these show up in a visual inspection. You cannot see a VSWR problem. You can only measure it.
Our Testing Protocol
| Step | Action | Tool | Acceptance Criteria |
|---|---|---|---|
| 1 | Pull 5 samples per 1,000 units | — | AQL Level II, General Inspection |
| 2 | Calibrate VNA with OSL standards | Keysight or Rohde & Schwarz VNA | Calibration valid for 24 hours |
| 3 | Mount antenna on reference ground plane | Aluminum plate, 30 cm × 30 cm | Consistent across all tests |
| 4 | Sweep 600–960 MHz | VNA S11 measurement | VSWR < 1.5 at all target frequencies |
| 5 | Sweep 1700–2700 MHz | VNA S11 measurement | VSWR < 1.5 at all target frequencies |
| 6 | Record and archive data | .s1p file + PDF report | Traceable to batch and date code |
| 7 | Ship report with goods | Email + printed copy in carton | Client receives before customs clearance |
What You Should Ask Your Supplier
If you are sourcing from any factory — not just us — here is what to demand:
- “Show me the VNA calibration certificate.” If the VNA has not been calibrated by an accredited lab within the last 12 months, the readings are not trustworthy.
- “What is your sampling plan?” If they say “we test one unit per order,” that is not enough. One unit tells you nothing about the other 4,999.
- “Can I get the raw .s1p files?” A PDF chart can be edited. A Touchstone data file is much harder to fake. Open it in your own software and verify.
- “Do you test on the bare antenna or the assembled product?” As I explained above, bare antenna testing is only half the picture. Installed-state testing is what matters.
Return Loss vs. VSWR — A Quick Reference
Many engineers prefer Return Loss9 (in dB) over VSWR. They are two ways to express the same thing. Here is a quick conversion so you can read any report:
- VSWR 1.0 = Return Loss ∞ dB (perfect, theoretical only)
- VSWR 1.5 = Return Loss -14 dB (industrial standard)
- VSWR 2.0 = Return Loss -9.5 dB (minimum acceptable)
- VSWR 3.0 = Return Loss -6 dB (reject)
When reading an S11 plot, remember: more negative is better. A value of -18 dB is better than -14 dB. If your supplier’s report shows S1110 worse than -14 dB at your target frequency, the antenna does not meet the 1.5 VSWR standard.
One More Thing About Cables
I want to flag something that catches people off guard. If your 4G antenna comes with a long coaxial cable — say, 3 meters or more — a low-quality cable can mask a bad antenna. Here is why: the cable itself has insertion loss. It absorbs some of the reflected energy before it gets back to the VNA. So the VNA sees less reflection and reports a lower VSWR. But in reality, the antenna is still reflecting energy. That energy just gets turned into heat inside the cable instead of reaching the module.
The fix is simple. Always test at the antenna connector, not at the module end. Or better yet, use time-domain gating on the VNA to isolate the antenna’s response from the cable’s loss. We do this as standard practice at Loyalty-Secu. Not every factory does.
Conclusion
Test VSWR with a calibrated VNA, demand batch reports with raw data, and always verify on the final assembled product — not the bare antenna alone.
1. Check the frequency bands (746–787 MHz) used by Verizon for LTE Band 13. ↩︎ 2. Find frequency specifications for T-Mobile’s LTE Band 71 (600 MHz). ↩︎ 3. Understand how reducing transmit power protects RF amplifiers from reflected energy. ↩︎ 4. Explore datasheets and specifications for Quectel 4G modules. ↩︎ 5. Master how Smith Charts plot impedance and help analyze antenna matching. ↩︎ 6. Learn about the industry-standard file format for S-parameter data exchange. ↩︎ 7. Discover Ansys HFSS for 3D electromagnetic simulation of antennas. ↩︎ 8. Understand how a ground plane affects antenna impedance and radiation patterns. ↩︎ 9. See how return loss in dB relates to VSWR and impedance matching quality. ↩︎ 10. Learn about the input reflection coefficient S11 used in VNA measurements. ↩︎