
I have watched too many solar surveillance projects fail for one reason: nobody did the battery math before installation. The system dies on the third rainy day, and the client calls you — angry.
To calculate standby days, divide the battery’s usable energy (Wh × DOD × efficiency) by the system’s total daily power consumption (Wh/day). For example, a 1200Wh LiFePO4 battery with 80% depth of discharge and 90% efficiency gives you 864Wh of usable energy. If your 4G PTZ system draws 240Wh per day, you get roughly 3.6 days of autonomy with zero solar input.
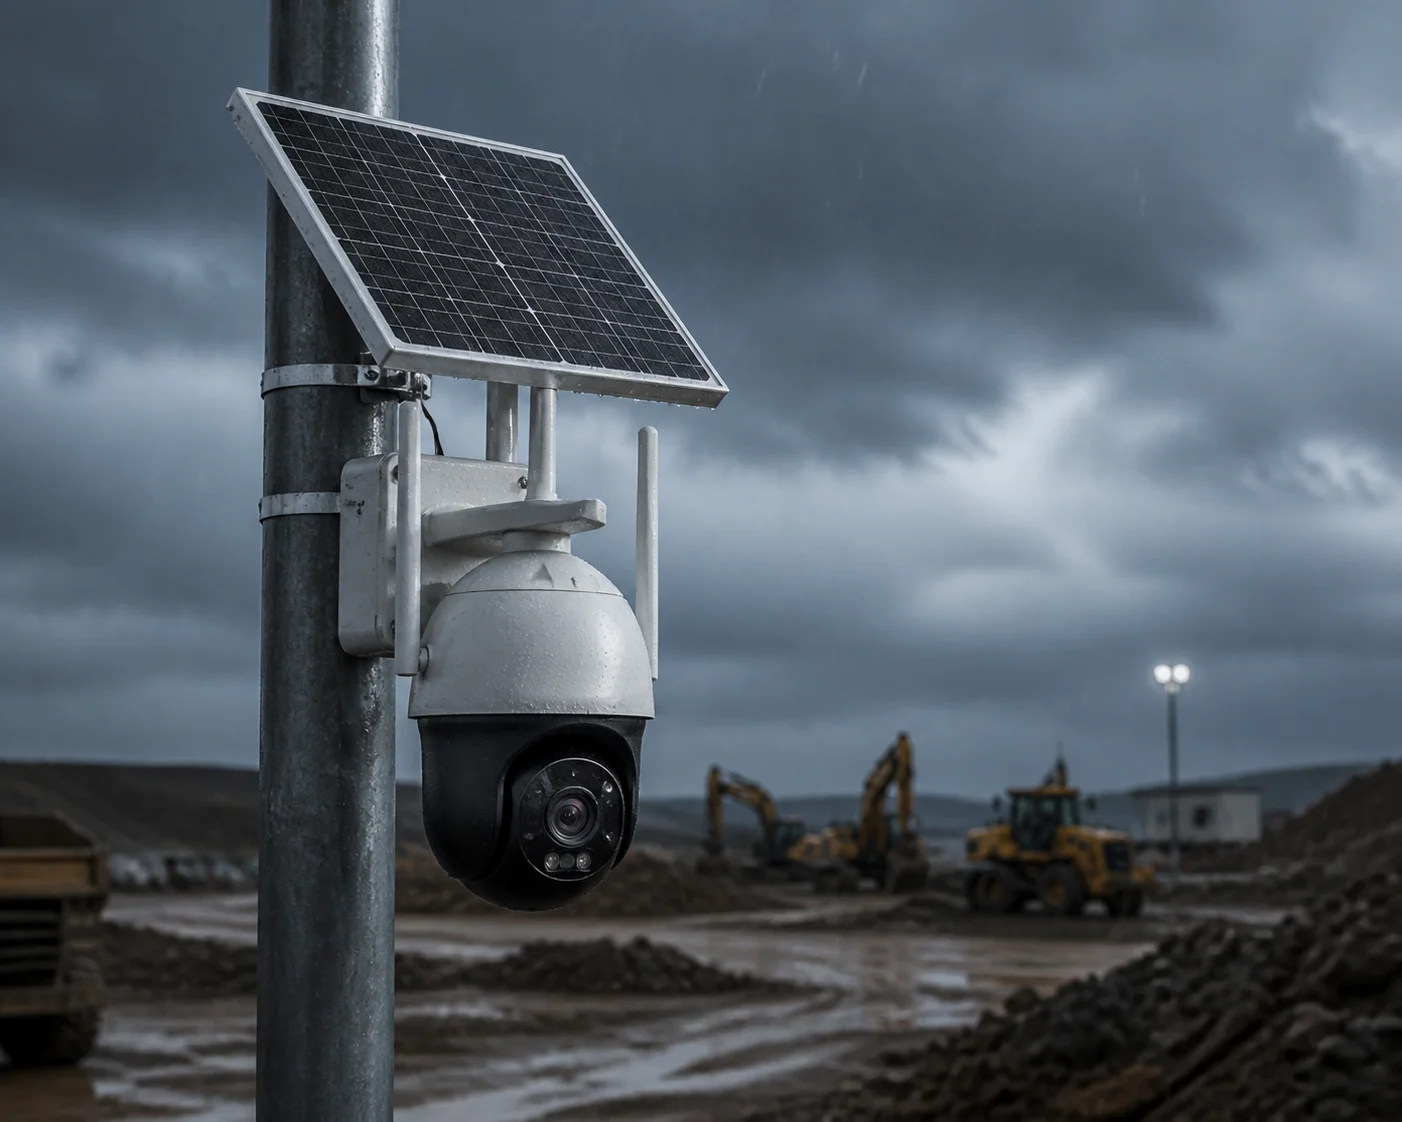 Solar PTZ camera battery standby days calculation
Below, I will walk you through each piece of this formula. I will show you the real numbers, the common mistakes, and the engineering tricks I have learned from over a decade of building solar PTZ systems 1 at Loyalty-Secu. Whether you are sizing a battery for a Texas ranch or a Canadian construction site, this guide gives you the exact math.
Table of Contents
What Is the Mathematical Formula to Predict Runtime During Consecutive Rainy Days?
I get this question from almost every integrator I work with. They buy a solar surveillance kit 2, and the first thing they ask is: “How many days will it last if the sun disappears?”
The core formula is: Autonomy Days = (Battery Capacity in Wh × DOD × η) ÷ (Average System Power in W × 24 hours). DOD is the depth of discharge (typically 0.8 for lithium), and η is system efficiency (typically 0.9). This gives you the number of full days the system can run with absolutely no solar charging.
 Battery autonomy formula for solar PTZ camera
Breaking Down Each Variable
Let me explain each part of the formula so you can plug in your own numbers.
| Variable | What It Means | Typical Value |
|---|---|---|
| Wh (Watt-hours) | Total energy stored in the battery. Calculated as Voltage × Ah. | 600Wh – 2400Wh |
| DOD (Depth of Discharge) | How much of the battery you can safely use before recharging. | 0.8 for LiFePO4, 0.5 for Lead-Acid |
| η (Efficiency) | Accounts for DC-DC conversion loss, cable loss, and controller loss. | 0.85 – 0.92 |
| Average Power (W) | The average wattage the whole system draws over 24 hours. | 6W – 15W for typical solar PTZ |
A Real-World Example
Let me walk you through a real scenario. Say you use a 12V 100Ah LiFePO4 battery 3. That gives you:
$$12V \times 100Ah = 1200Wh$$
Now apply DOD and efficiency:
$$1200Wh \times 0.8 \times 0.9 = 864Wh \text{ (usable)}$$
If your 4G PTZ system draws an average of 10W around the clock:
$$10W \times 24h = 240Wh/day$$
So your standby days are:
$$864Wh \div 240Wh/day = 3.6 \text{ days}$$
That means roughly 3.5 days with zero sunlight. I always tell my clients: this is the worst-case number. In reality, even on cloudy days, your solar panel low-light performance 4 still produces about 10–20% of its rated output. So the actual runtime is usually a bit longer. But for project planning, I always use zero solar input as the baseline. It keeps you safe.
The Reverse Calculation — Sizing Your Battery
If you already know how many rainy days you need to survive, just flip the formula:
$$\text{Required Wh} = \frac{\text{Daily Consumption (Wh)} \times \text{Target Days}}{\text{DOD} \times \eta}$$
For example, if you want 5 days of backup at 240Wh/day:
$$\frac{240 \times 5}{0.8 \times 0.9} = 1667Wh$$
That is about a 12V 139Ah battery. I usually round up to the next standard size — so I would recommend a 12V 150Ah pack. This “round-up” habit has saved many of my clients from unexpected shutdowns.
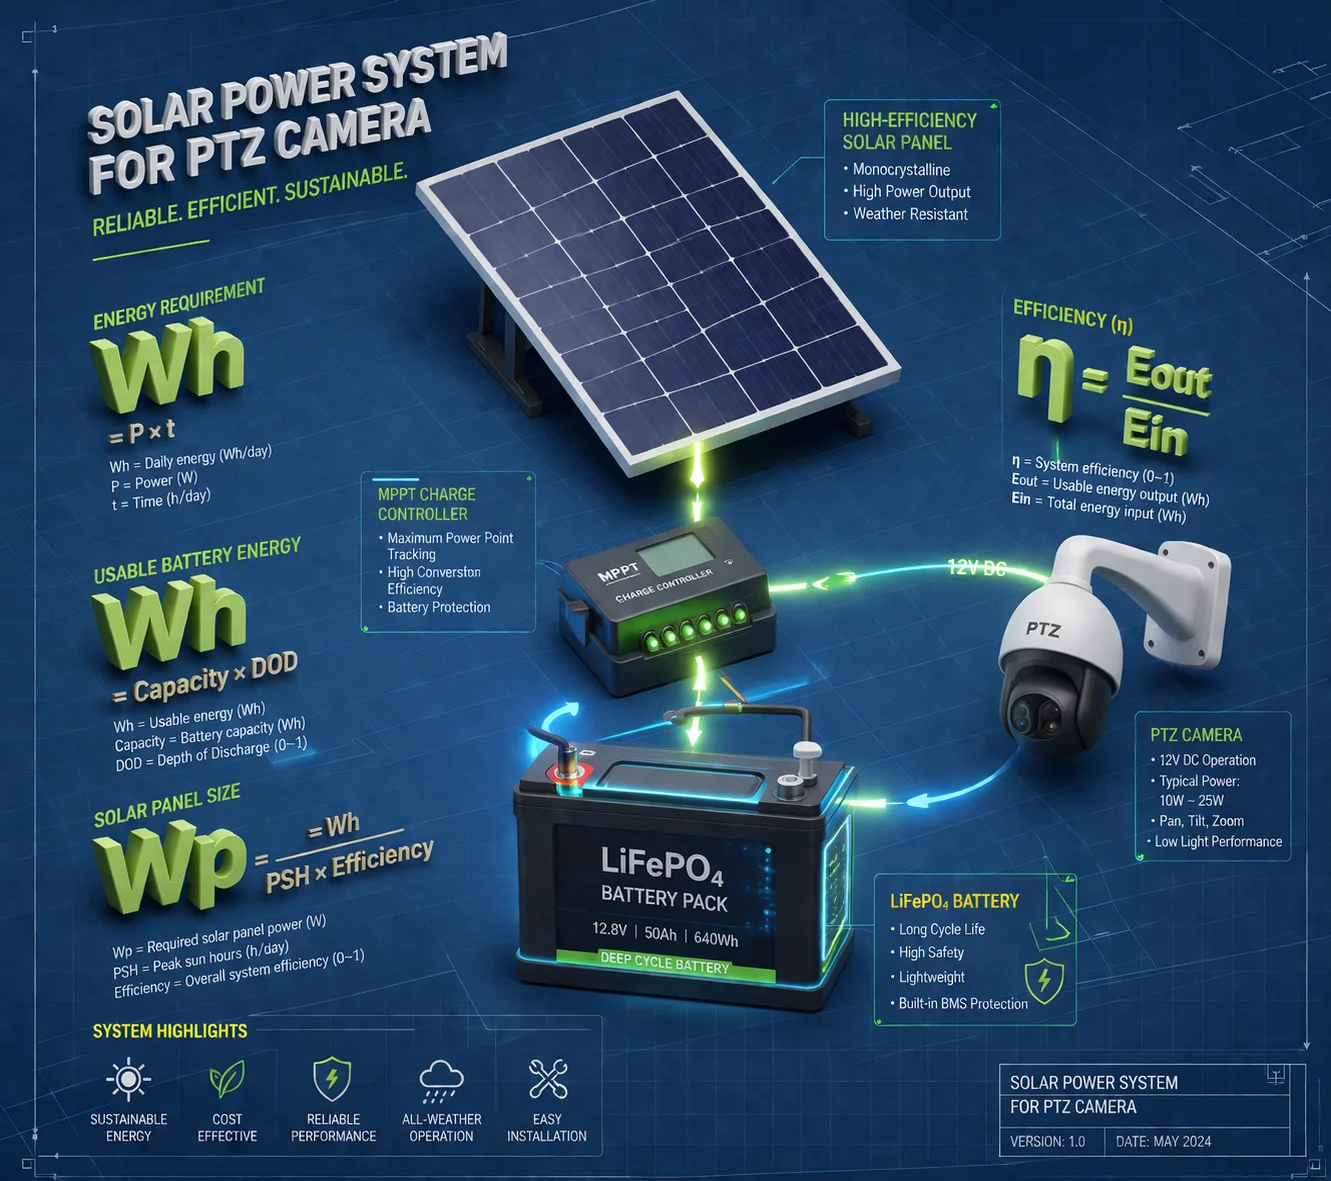
Does the 4G Module’s Power Consumption Significantly Reduce My Standby Time?
I have seen integrators ignore the 4G module when they estimate power draw. Then they wonder why the battery dies a full day earlier than expected.
Yes, a 4G module adds 2W–5W of constant power draw, which can reduce your standby time by 20–40% depending on total system load. Over 24 hours, a 4W 4G module alone consumes 96Wh — that is a meaningful portion of a small battery’s usable capacity.
 4G module power consumption impact on solar camera battery
Why 4G Power Draw Is Easy to Underestimate
Most people look at the 4G module’s spec sheet and see “3W typical.” But that number is only for idle mode. When the module is actively streaming video or uploading alarm clips, the draw spikes to 5W–8W. And if the cellular signal is weak — like in a rural area or a remote farm — the module boosts its transmit power to maintain the connection. I have measured 4G modules pulling over 7W in low-signal conditions for hours at a time.
Here is a breakdown I use in my own project proposals:
| 4G Activity State | Power Draw | Hours per Day | Daily Energy (Wh) |
|---|---|---|---|
| Idle / Heartbeat only | 2W – 3W | 20h | 40 – 60Wh |
| Live streaming / Clip upload | 5W – 8W | 2h | 10 – 16Wh |
| Low-signal boosted transmit | 6W – 9W | 2h | 12 – 18Wh |
| Estimated 4G daily total | 24h | 62 – 94Wh |
How I Handle This in System Design
At Loyalty-Secu, I build this into the firmware. Our 4G solar cameras 5 use an adaptive heartbeat strategy. When the battery voltage is healthy (above 12.2V), the module maintains a normal connection — checking in every 30 seconds. When the voltage drops below 11.8V, the firmware automatically stretches the heartbeat interval to every 5 minutes. This alone cuts 4G power use by about 60%.
I also give my clients the option to set “upload schedules.” Instead of pushing every motion event in real time, the camera stores clips locally and uploads them in a batch during peak solar hours (10am–2pm). This way, the 4G module is mostly idle at night when there is no solar input. It is a simple change, but it can add a full extra day of standby time.
The lesson here is clear: do not treat 4G as a “free” feature. Budget its power just like you budget the camera and the IR illuminator power draw 6. And if your deployment site has weak signal, add 20% to your 4G power estimate.
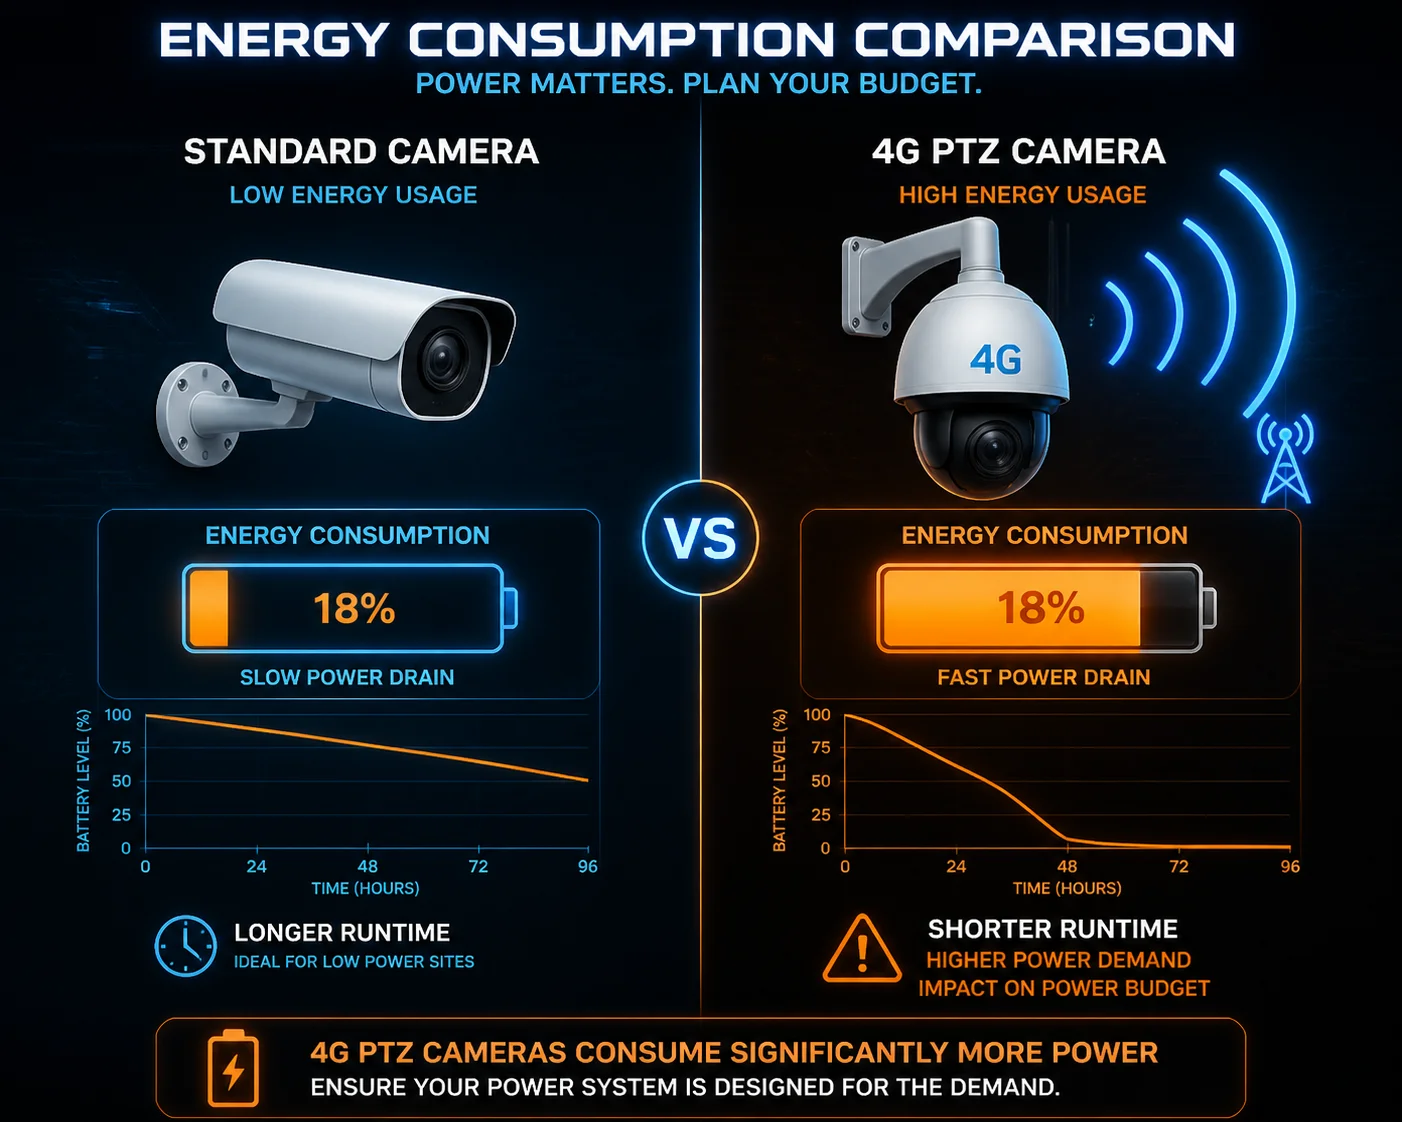
How Much “Reserve Capacity” Should I Leave to Prevent Deep Discharge Damage?
I learned this lesson the hard way. Early in my career, I let a client discharge their lead-acid batteries to 100% DOD. Within six months, the batteries were dead. That single mistake cost more than the entire camera system.
You should always reserve at least 20% of a LiFePO4 battery’s capacity (80% DOD) and 50% of a lead-acid battery’s capacity (50% DOD). Going beyond these limits accelerates permanent capacity loss. For cold climates below 0°C, add another 15–30% buffer to account for reduced chemical efficiency.
 Battery reserve capacity for solar surveillance system
Understanding DOD and Battery Lifespan
DOD stands for Depth of Discharge. It tells you what percentage of the battery’s total energy you actually use before recharging. The deeper you discharge, the fewer charge cycles the battery can survive.
Here is a quick reference I share with every client:
| Battery Type | Recommended DOD | Cycle Life at This DOD | Notes |
|---|---|---|---|
| Lead-Acid (AGM/GEL) | 50% | ~500 cycles | Most affordable upfront, but short lifespan |
| LiFePO4 | 80% | ~3000 cycles | Best long-term value for solar surveillance |
| Ternary Lithium (NMC) | 70% | ~1000 cycles | Lighter weight, but less stable in heat |
The Cold Weather Factor
This is something many people in warm climates forget. But if you sell to clients in Canada, the northern US, or northern Europe, you cannot ignore temperature.
At 0°C, a LiFePO4 battery loses about 10–15% of its usable capacity. At -10°C, that loss jumps to 20–30%. Lead-acid battery cold weather performance 7 is even worse in the cold.
I add a temperature correction factor to the formula for any project below 5°C:
$$\text{Adjusted Usable Wh} = Wh \times DOD \times \eta \times T_{correction}$$
For cold climates, I set $T_{correction}$ = 0.7 to 0.85, depending on how extreme the winter gets.
So for a 1200Wh battery in a Canadian winter:
$$1200 \times 0.8 \times 0.9 \times 0.75 = 648Wh$$
Compare that to the 864Wh you get in a mild climate. That is a 25% reduction — almost a full day of lost standby time. I always tell my clients: size your battery for your worst month, not your best month.
The Self-Discharge Buffer
Even when the system is completely off, batteries slowly lose charge. LiFePO4 battery self-discharge rates 8 are about 2–3% per month. Lead-acid can be 5–10% per month. For long-term deployments, I add a 5% buffer on top of everything else. It is a small number, but over a two-week rainy spell, it adds up.
My Engineering Rule of Thumb
After years of field experience, I follow what I call the Rule of Three:
- Calculate your theoretical standby days using the formula.
- Multiply the required battery capacity by 1.25 as a safety margin.
- Make sure the final number gives you at least 3 full days of zero-solar autonomy.
If a project cannot meet that 3-day minimum, I recommend either a bigger battery or enabling our firmware’s low-power sleep mode. This rule has kept my warranty return rate under 1% for the past five years.
Can the Camera Calculate and Report Its Own “Days of Autonomy” via Firmware?
I used to get phone calls from clients asking, “Han, how much battery is left on my camera at Site 7?” They had no way to know without driving out to check. That is why I pushed our R&D team to build this feature directly into the firmware.
Yes, modern solar PTZ cameras can estimate and report remaining days of autonomy through firmware. By monitoring real-time battery voltage, current draw, and historical power patterns, the system calculates how many days it can survive without solar input and sends this data to your VMS or mobile app via 4G.
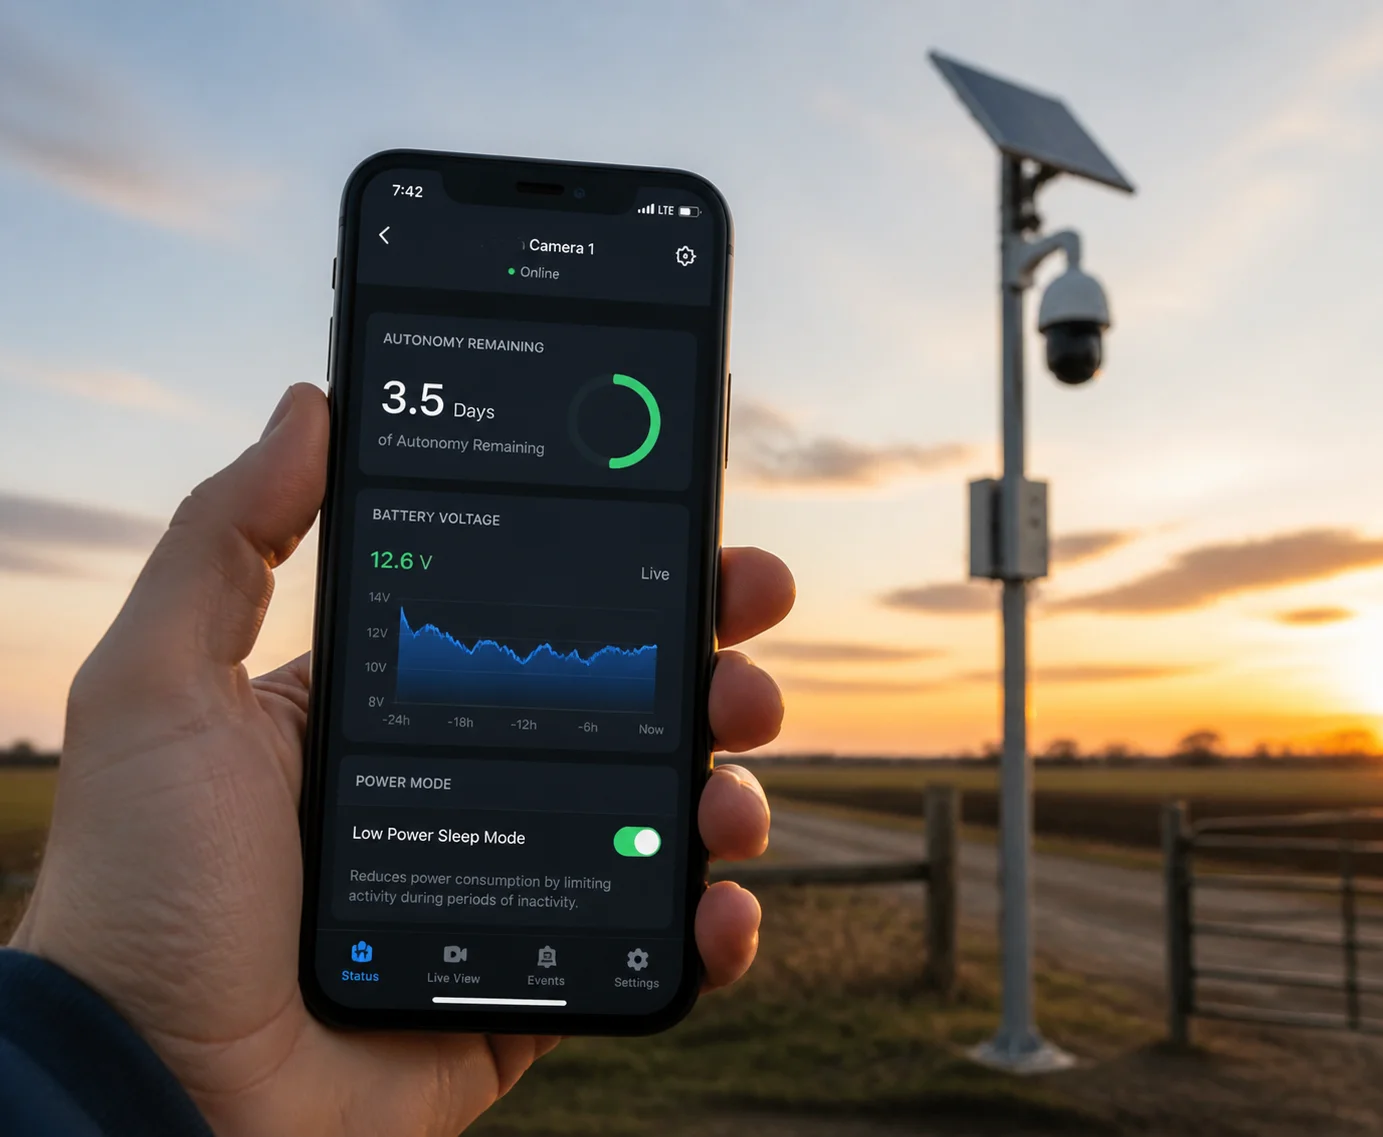 Firmware battery autonomy reporting for solar PTZ camera
How the Firmware Does the Math
The logic inside our firmware is based on the same formula I showed you earlier. But instead of using fixed numbers, it uses live data:
- Real-time battery voltage — mapped to a state-of-charge (SOC) curve specific to the battery chemistry.
- Rolling average power draw — measured over the past 24–48 hours to capture actual usage patterns.
- Remaining usable Wh — calculated from SOC, minus the DOD floor (we default to 20% reserve).
The camera then divides the remaining usable Wh by the rolling average daily consumption. The result is a “Days Remaining” value that updates every hour.
What Gets Reported and How
Our cameras push this data over 4G using standard protocols. If your client uses a VMS platform like Milestone 9 or a cloud platform, they can see the battery status on their dashboard. We also support MQTT for IoT-style integrations.
Here is what the firmware reports:
- Battery voltage (V)
- State of charge (%)
- Estimated days remaining (number)
- Solar input status (charging / not charging / fault)
- Low battery alert (triggered when days remaining drops below a user-set threshold — default is 1.5 days)
The Low-Power Sleep Mode
This is the feature I am most proud of. When the battery voltage drops below 11.5V (user-adjustable), the camera enters a deep sleep mode. Here is what happens:
- The laser/IR illuminator turns off completely.
- The 4G module switches to a slow heartbeat (once every 10 minutes).
- Video recording stops — but the PIR motion sensor stays active.
- If the PIR detects a person or vehicle, the camera wakes up fully within 3 seconds, records a clip, uploads it, and goes back to sleep.
In this mode, power draw drops from 10W down to about 1.5W–2W. That means a battery that would last 3.5 days in normal mode can now last 10–12 days in sleep mode. For remote sites like oil fields, farms, and construction zones, this feature is the difference between a system that survives a storm and one that goes dark.
Why This Matters for Your Business
If you are a system integrator, this feature saves you truck rolls. You do not need to drive 200 miles to check a battery. You see the status on your screen. And when the system sends a low-battery alert, you have a 1–2 day window to respond — either by dispatching a crew or by remotely enabling sleep mode from your phone.
I built this because I understand the real cost of a site visit. For integrators like David working in rural Texas or remote Alberta, a single truck roll can cost $500–$1,000 in labor and fuel. If the firmware can prevent even one unnecessary trip per year, it pays for itself.
Conclusion
Standby days come down to simple math: usable battery Wh divided by daily system consumption. Get the inputs right — DOD, efficiency, 4G draw, temperature — and you will never be surprised by a dead camera again. For advanced deployments, consider using solar battery monitoring software 10 to track multiple remote sites from a single dashboard.
1. Overview of durable solar PTZ designs for remote surveillance. ↩︎ 2. Step-by-step guide to sizing solar panels and batteries for security. ↩︎ 3. Why LiFePO4 is the preferred battery for off-grid solar systems. ↩︎ 4. How modern solar panels generate power on overcast days. ↩︎ 5. Technical deep-dive into 4G modem power consumption modes. ↩︎ 6. How to calculate total power draw including IR LEDs. ↩︎ 7. Battery University guide to charging lead-acid below freezing. ↩︎ 8. Long-term storage self-discharge data for LiFePO4 vs lead-acid. ↩︎ 9. Integrating solar-powered camera telemetry with Milestone XProtect. ↩︎ 10. Real-time remote battery monitoring for off-grid solar installations. ↩︎