
I’ve seen too many suppliers claim “21%+ efficiency” on their datasheets. But when you do the math, the numbers don’t add up. This gap costs real money on real projects.
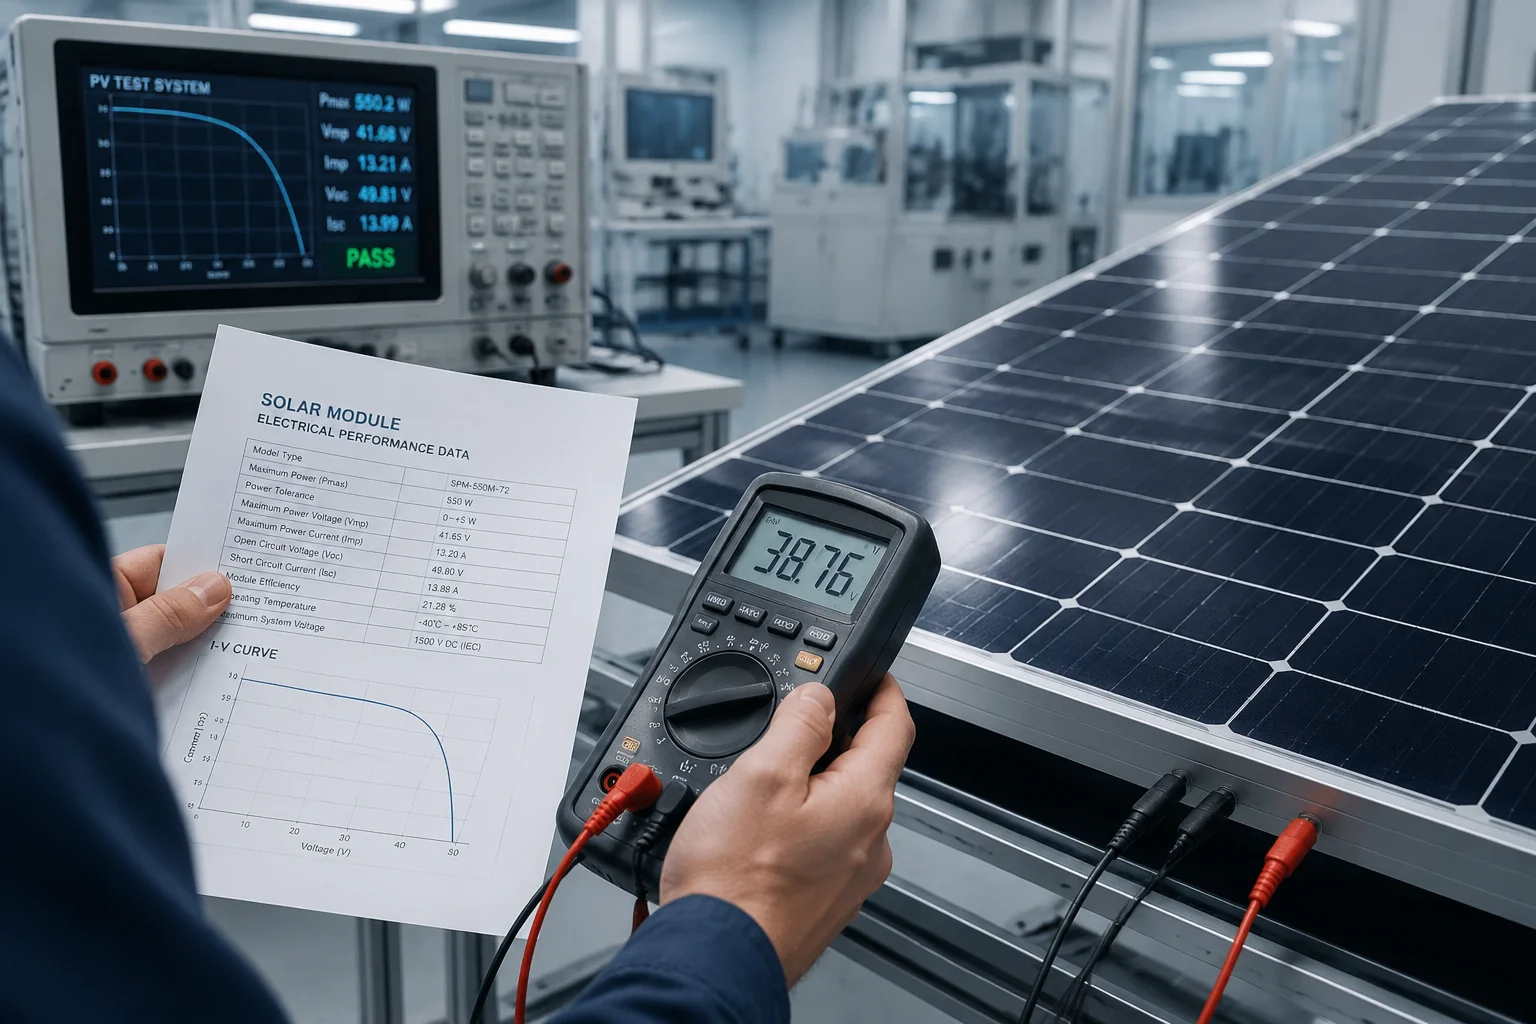
The most reliable way to verify solar panel efficiency is to reverse-calculate it using the panel’s rated wattage and physical dimensions under Standard Test Conditions (STC), where sunlight intensity is fixed at 1000W/m². If the math doesn’t confirm 21%, the claim is false.
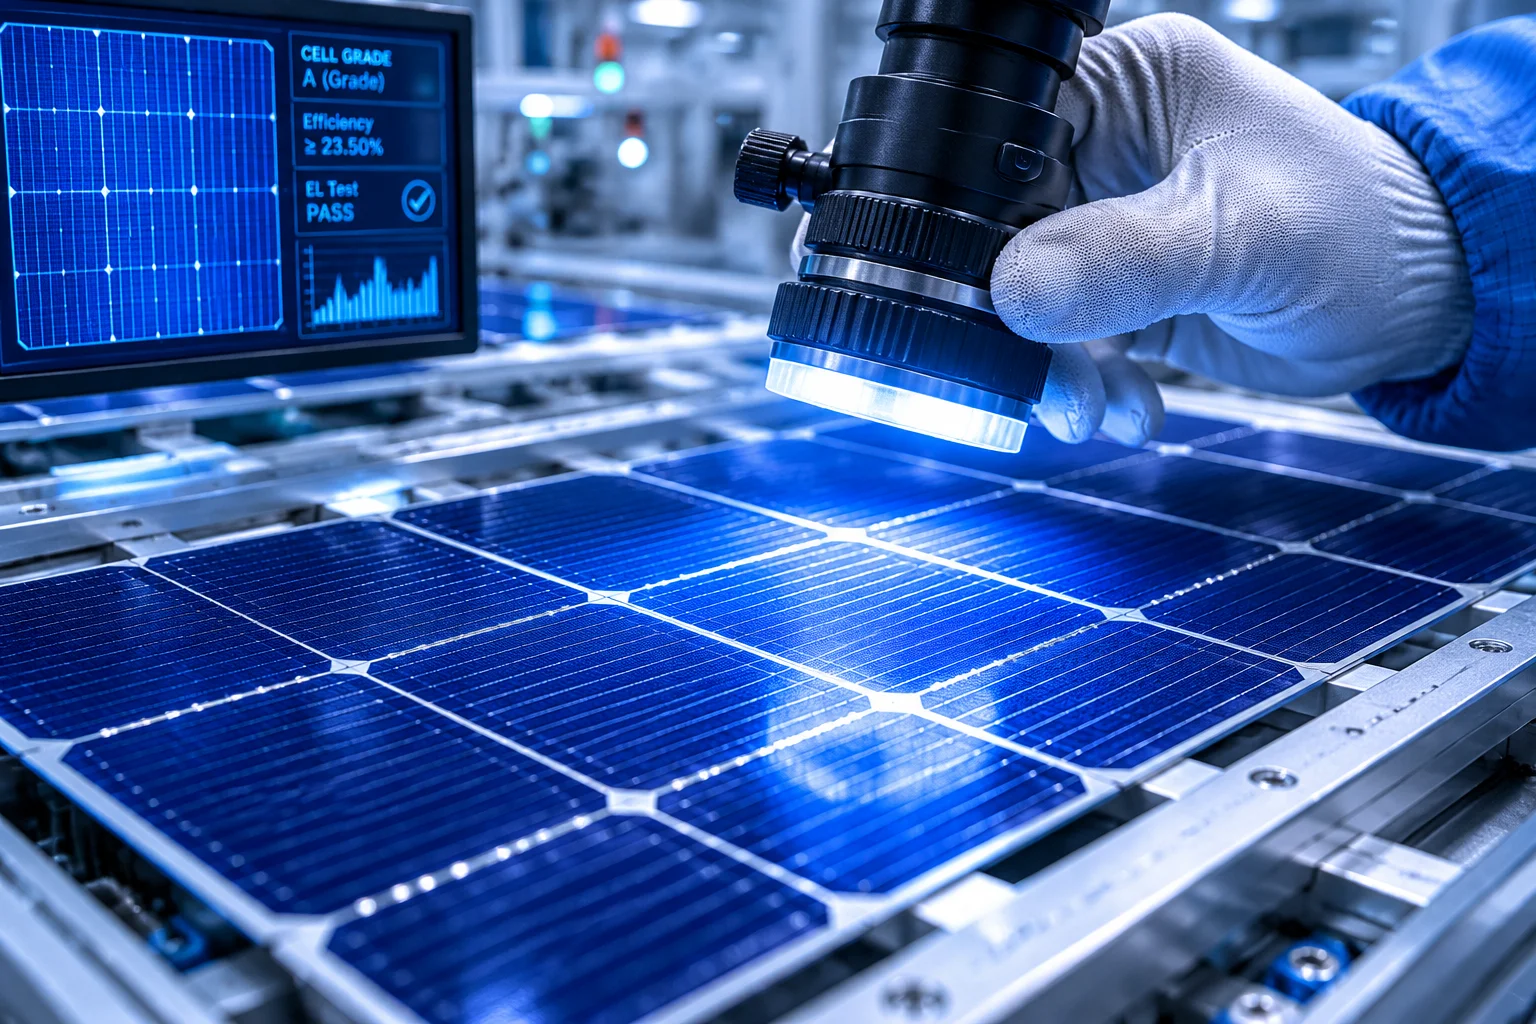
 solar panel efficiency verification test
Below, I break down four critical questions you should ask your supplier before placing any order. Each one gives you a different angle to confirm or deny that efficiency claim. I’ve used these checks on dozens of solar-powered surveillance projects, and they’ve saved me from bad panels more than once.
Table of Contents
Can I See the “Flash Test” Report for the Specific Batch of Solar Panels in My Order?
Every time I receive a new shipment of solar panels for our 4G solar PTZ camera systems, the first thing I ask for is the Flash Test report. Without it, you’re trusting a number on a sticker.
Yes, you should always request the Flash Test report tied to your exact production batch. This report shows the actual measured output of each panel under simulated sunlight (STC), and it is the only factory-level proof that your panels hit the claimed efficiency.
 flash test report solar panel batch verification
What Is a Flash Test?
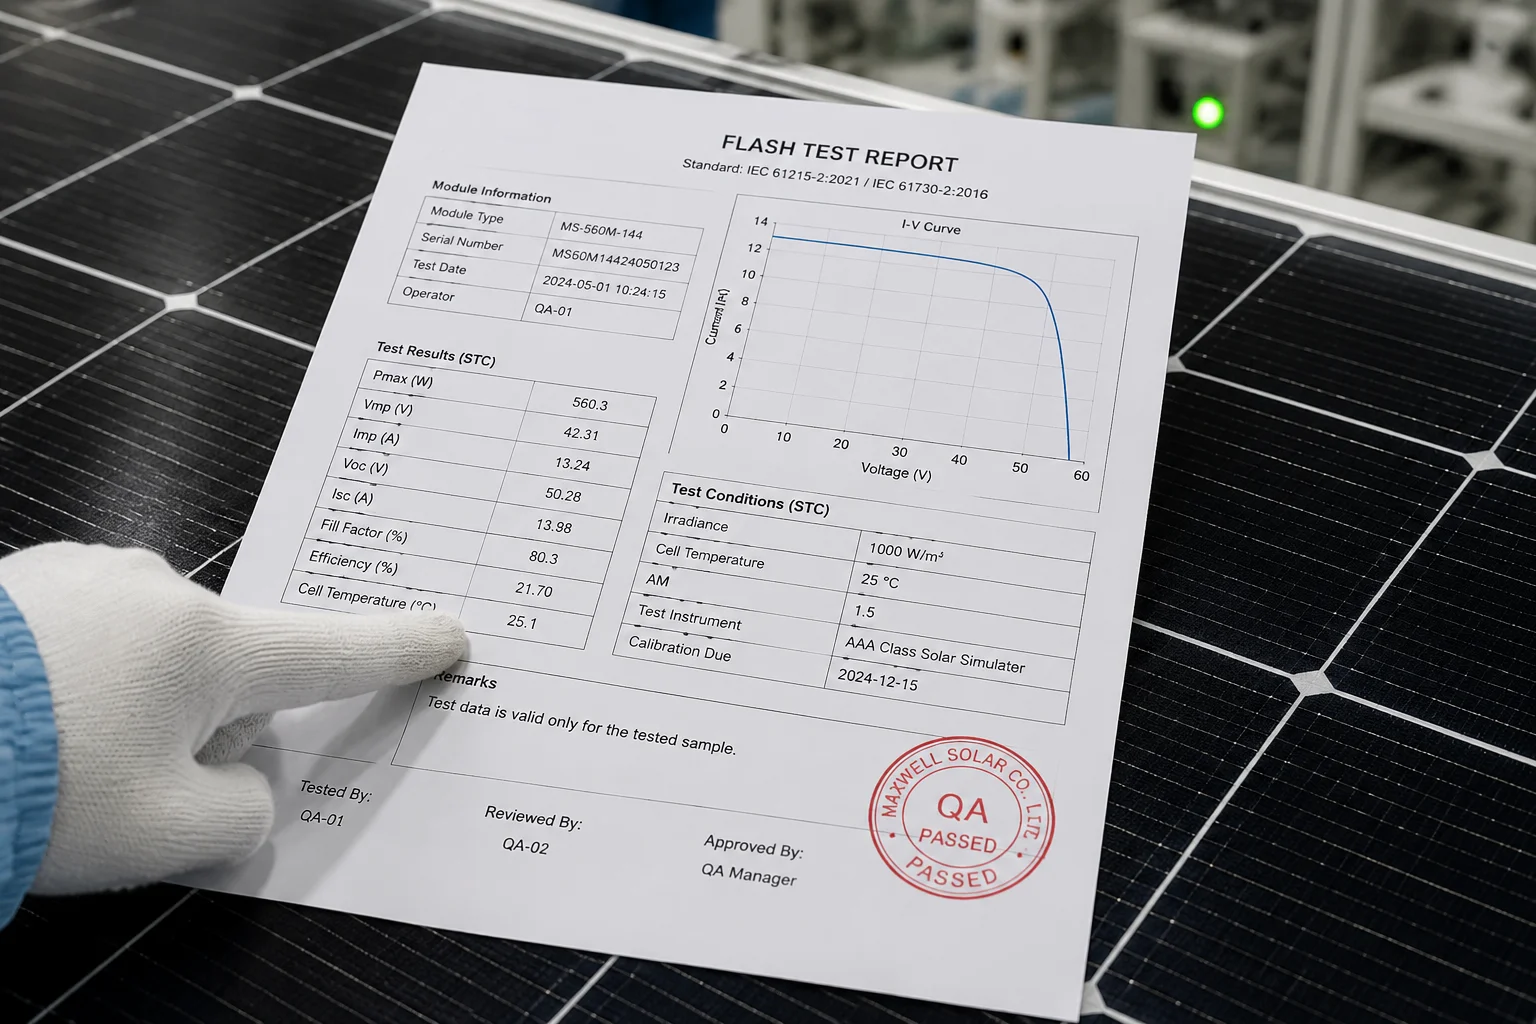
A Flash Test1 is a quick electrical performance test done at the end of the production line. The factory uses a solar simulator — a machine that produces a controlled flash of light at exactly 1000W/m² — and measures the panel’s output in that instant. The result is an I-V curve2 (current vs. voltage curve) that tells you everything about the panel’s real performance.
Every serious manufacturer does this test on every single panel. The data is recorded and can be traced back to your specific order. If a supplier says they “don’t have” this report, that is a red flag.
What to Look for in the Report
Here are the key values you need to check:
| Parameter | What It Means | What to Look For |
|---|---|---|
| Pmax (W) | Maximum power output | Should match or exceed the label rating |
| Vmp (V) | Voltage at max power | Should be close to datasheet value |
| Imp (A) | Current at max power | Should be close to datasheet value |
| Fill Factor (%) | How “square” the I-V curve is | Above 75% is good; below 70% is a concern |
| Efficiency (%) | Calculated from Pmax and area | Must exceed 21% if that’s the claim |
Why Batch-Specific Reports Matter
Some suppliers will show you a Flash Test report from a “sample batch” or a “golden sample.” That means nothing for your order. Production quality varies. Cell grades shift between batches. The report must match your purchase order number or production date.
I always cross-check the serial numbers on the report against the serial numbers on the panels I receive. If they don’t match, I reject the shipment. In our business — building solar-powered PTZ surveillance systems for remote sites — a panel that underperforms by even 5% can mean the camera shuts down at night. There is no room for guessing.
How to Request It
Send your supplier this exact message: “Please provide the Flash Test report (I-V curve data) for the production batch associated with PO #[your order number]. I need Pmax, Vmp, Imp, Fill Factor, and efficiency values for each panel.”
If they can provide this within 48 hours, you’re working with a real manufacturer. If they stall or send generic documents, consider that a warning.
How Do I Calculate the Real-World Efficiency Based on the Panel’s Dimensions and Wattage?
I use this calculation on every single panel we source for our solar surveillance kits. It takes 30 seconds and requires nothing more than a tape measure and the label on the back of the panel.
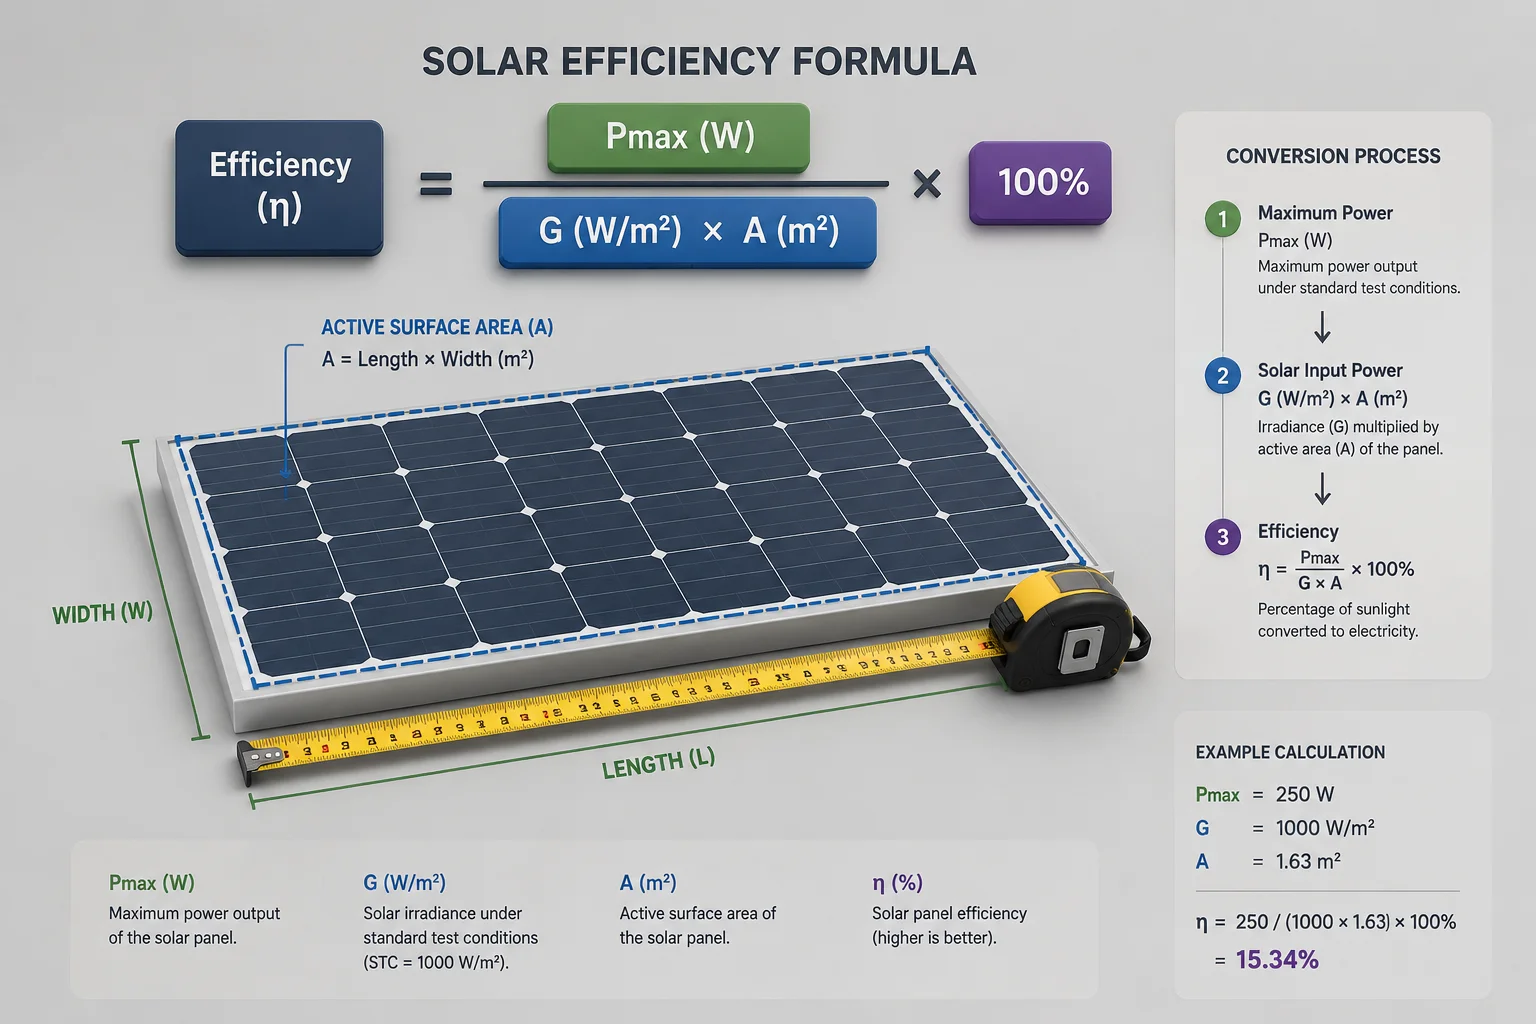
To calculate efficiency, divide the panel’s rated wattage (Pmax) by the product of its area in square meters and 1000 (the STC irradiance value), then multiply by 100%. If the result is below 21%, the supplier’s claim is exaggerated.
 solar panel efficiency calculation dimensions wattage
The Formula
The standard efficiency formula is:
$$Efficiency = \frac{P_{max}}{Area \times 1000} \times 100\%$$
- Pmax: The maximum output power printed on the panel’s label (in Watts).
- Area: Length × Width of the panel’s active surface (in m²).
- 1000: The standard irradiance under STC (1000W/m²).
A Real Example
Let’s say you have a panel rated at 100W. You measure it: 0.6m × 0.75m = 0.45m².
Calculation: 100 ÷ (0.45 × 1000) = 0.222 = 22.2%
That panel genuinely exceeds 21%. Good.
Now let’s say another supplier offers a “100W, 21%+ efficiency” panel, but the dimensions are 0.7m × 0.8m = 0.56m².
Calculation: 100 ÷ (0.56 × 1000) = 0.178 = 17.8%
That panel is nowhere near 21%. The supplier lied.
Common Size-to-Efficiency Reference
Here’s a quick reference table I use when evaluating panels for our solar PTZ systems:
| Rated Power (W) | Panel Area (m²) | Calculated Efficiency | Verdict |
|---|---|---|---|
| 60W | 0.27 | 22.2% | ✅ Exceeds 21% |
| 100W | 0.45 | 22.2% | ✅ Exceeds 21% |
| 100W | 0.56 | 17.8% | ❌ Below 21% |
| 150W | 0.68 | 22.1% | ✅ Exceeds 21% |
| 200W | 1.05 | 19.0% | ❌ Below 21% |
Why This Matters for Off-Grid Projects
In our work at , we design solar-powered 4G PTZ camera systems for locations with no electricity. The panel size directly affects the mounting structure, wind load, and installation cost. A panel that claims 21% but actually delivers 18% means you need a bigger panel to get the same power. That means a bigger pole, a heavier bracket, and more labor cost. For a single camera, the difference might be small. For a 50-camera project across a remote pipeline, it adds up to thousands of dollars in wasted material and time.
Always do the math yourself. Never trust the sticker alone.
Will the Efficiency Drop Significantly After 12 Months of Exposure to Industrial Smog?
I’ve deployed solar panels in factory zones, construction sites, and mining areas. After one year, some panels lost almost 15% of their output. Others barely lost 3%. The difference comes down to panel quality and surface coating.
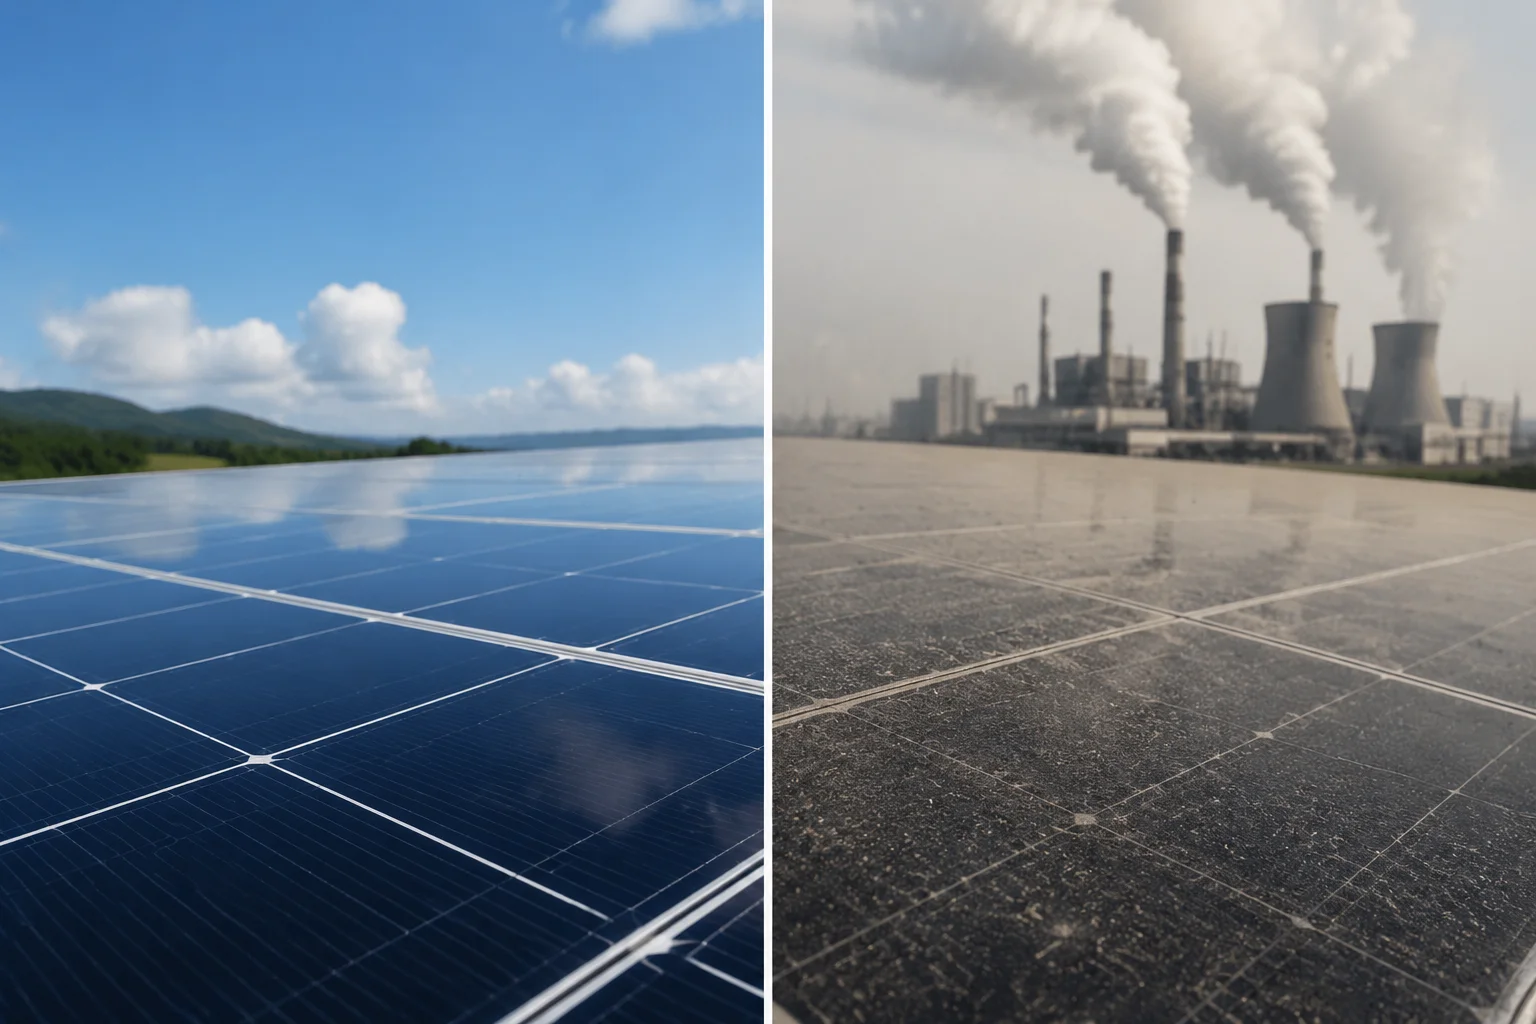
Yes, industrial smog causes measurable efficiency loss — typically 5% to 15% in the first year — due to particulate buildup, chemical film deposits, and micro-corrosion on the glass surface. High-quality panels with anti-soiling coatings and proper maintenance schedules lose far less.
 solar panel efficiency degradation industrial smog environment
Why Smog Kills Efficiency
Industrial smog contains fine particles (PM2.5, PM10), sulfur compounds, oil mist, and calcium dust. These settle on the panel surface and form a film that blocks sunlight. Unlike rain-washed rural environments, industrial areas often have sticky, oily deposits that rain alone cannot remove.
The effect is cumulative. After 3 months, you might see a 3-5% drop. After 12 months without cleaning, it can reach 10-15% in heavy industrial zones.
Degradation vs. Soiling: Know the Difference
There are two types of efficiency loss:
- Soiling loss — dirt on the surface. This is reversible with cleaning.
- Degradation — actual cell damage from UV, heat cycling, or chemical corrosion. This is permanent.
Most of what you see in the first year is soiling. But in harsh chemical environments (near cement plants, steel mills, or refineries), you can also get permanent micro-corrosion on the glass or anti-reflective coating. This is why panel quality matters.
What to Ask Your Supplier
| Question | Why It Matters | Good Answer |
|---|---|---|
| Does the glass have an anti-soiling coating3 or hydrophobic coating4? | Reduces particle adhesion | Yes, with test data |
| What is the annual degradation rate? | Shows long-term reliability | ≤0.5% per year |
| Is the panel certified to IEC 617015 (salt mist) or IEC 600686 (SO2 corrosion)? | Proves resistance to harsh environments | Yes, with certificate |
| What cleaning interval do you recommend? | Practical maintenance planning | Every 3-6 months for industrial sites |
My Recommendation for Harsh Environments
For our solar PTZ camera deployments in industrial zones, I always specify panels with tempered glass that has a hydrophobic nano-coating. I also design the mounting angle at 15° minimum tilt — this helps rain wash off loose particles naturally.
If you’re deploying in a smog-heavy area, budget for quarterly cleaning. A simple water rinse with a soft brush restores 95% of lost output. The real danger is ignoring it for a full year and then wondering why your cameras are shutting down every night.
Does the Factory Use A-Grade Solar Cells from Tier-1 Manufacturers to Ensure Efficiency?
I’ve opened panels from cheap suppliers and found cracked cells, color mismatches, and even B-grade rejects mixed in with A-grade cells. You cannot see this from the outside. You have to ask the right questions before you buy.
Reputable factories use A-grade solar cells7 from Tier-1 cell manufacturers8 like LONGi, JA Solar, or Tongwei. A-grade cells have no visible defects, consistent color, and verified electrical performance. Using anything less makes it impossible to reliably achieve 21%+ efficiency across a full panel.
 A-grade solar cells Tier-1 manufacturer quality inspection
What Does “A-Grade” Actually Mean?
Solar cells are sorted into grades after production based on visual and electrical inspection:
- Grade A: No cracks, no color variation, full electrical performance. Used in premium panels.
- Grade B: Minor visual defects (small color spots, slight chips). Slightly lower performance. Used in budget panels.
- Grade C/D: Visible cracks, significant color mismatch, reduced output. Used in very cheap or off-spec products.
A panel built with Grade B or C cells might still work. But it will never hit 21% efficiency consistently. And it will degrade faster because micro-cracks grow over time under thermal stress.
Who Are Tier-1 Cell Manufacturers?
“Tier-1” in the solar industry usually refers to Bloomberg New Energy Finance (BNEF) classification13. But for cell suppliers specifically, the key names are:
- LONGi Green Energy9 — world’s largest mono-Si wafer and cell producer
- JA Solar10 — major cell and module manufacturer
- Tongwei (TW Solar)11 — one of the largest cell-only producers
- Aiko Solar12 — known for high-efficiency ABC cells
These companies invest billions in R&D and maintain strict quality control. Their A-grade cells consistently deliver 22%+ cell-level efficiency (which translates to 21%+ at the module level after losses from spacing, busbars, and glass).
How to Verify Cell Grade and Source
Ask your panel supplier these questions:
- “Which company supplies your solar cells?”
- “Can you provide the cell supplier’s test report or bin sorting data?”
- “Do you have a supply agreement or purchase records from the cell manufacturer?”
A factory that buys cells from the open spot market (rather than directly from a Tier-1 supplier) has less control over quality. They might get a mix of grades in one shipment. A factory with a direct supply agreement and incoming quality inspection (IQI) process is far more reliable.
Why This Matters for Long-Term Projects
In my experience building solar-powered surveillance systems, the cell grade determines not just day-one efficiency but also how the panel performs in year 3, year 5, and beyond. A-grade cells from Tier-1 suppliers have lower rates of potential-induced degradation (PID), light-induced degradation (LID), and hot-spot formation.
If you’re building a system that needs to run for 5-10 years in a remote location — like a solar 4G PTZ camera on a pipeline or a farm — you cannot afford to gamble on cell quality. The cost difference between A-grade and B-grade panels is maybe 10-15%. The cost of a truck roll to replace a failed panel in a remote area is 10x the panel price.
Always verify the cell source. Always demand A-grade. And always do the efficiency math yourself.
Conclusion
Verify solar panel efficiency with math, not marketing. Calculate it from dimensions and wattage, demand batch-specific Flash Test reports, and confirm A-grade Tier-1 cells. These steps protect your project and your budget.
1. Learn how a Flash Test provides the actual I-V curve and efficiency data for a solar panel under simulated STC. ↩︎ 2. Explore how the current-voltage curve reveals key performance parameters like Pmax, Vmp, and Imp. ↩︎ 3. Anti-soiling coatings reduce particle adhesion and help maintain efficiency in dusty or smoggy environments. ↩︎ 4. Hydrophobic coatings cause water to bead and roll off, carrying dirt away to reduce soiling losses. ↩︎ 5. IEC 61701 certifies solar panels for salt mist corrosion resistance, critical for coastal and industrial sites. ↩︎ 6. IEC 60068 covers environmental testing including SO2 corrosion, important for panels exposed to industrial pollution. ↩︎ 7. A-grade cells have no visual defects and full electrical performance, essential for achieving high efficiency. ↩︎ 8. Tier-1 classification by BNEF identifies the most bankable and reliable solar manufacturers worldwide. ↩︎ 9. LONGi is the world’s largest monocrystalline silicon wafer and cell producer, known for high-efficiency products. ↩︎ 10. JA Solar is a major solar cell and module manufacturer with a strong global reputation for quality. ↩︎ 11. Tongwei is one of the largest dedicated solar cell producers, supplying A-grade cells to top module makers. ↩︎ 12. Aiko Solar is known for its high-efficiency ABC (All Back Contact) cell technology, enabling over 23% module efficiency. ↩︎ 13. BNEF’s Tier-1 classification helps buyers identify financially stable and reliable solar manufacturers. ↩︎