
I run solar security projects in remote sites, and I know one small blockage can turn into a big uptime problem fast. Snow, leaves, or dirt can quietly cut power and trigger outages.
Yes, AI1 can intelligently identify and alert for snow or leaf blockage on a solar panel when it combines power data, image analysis, and sensor fusion2. It can detect abnormal charging patterns, confirm visual blockage when the panel is visible, and send maintenance alerts before the system fails.
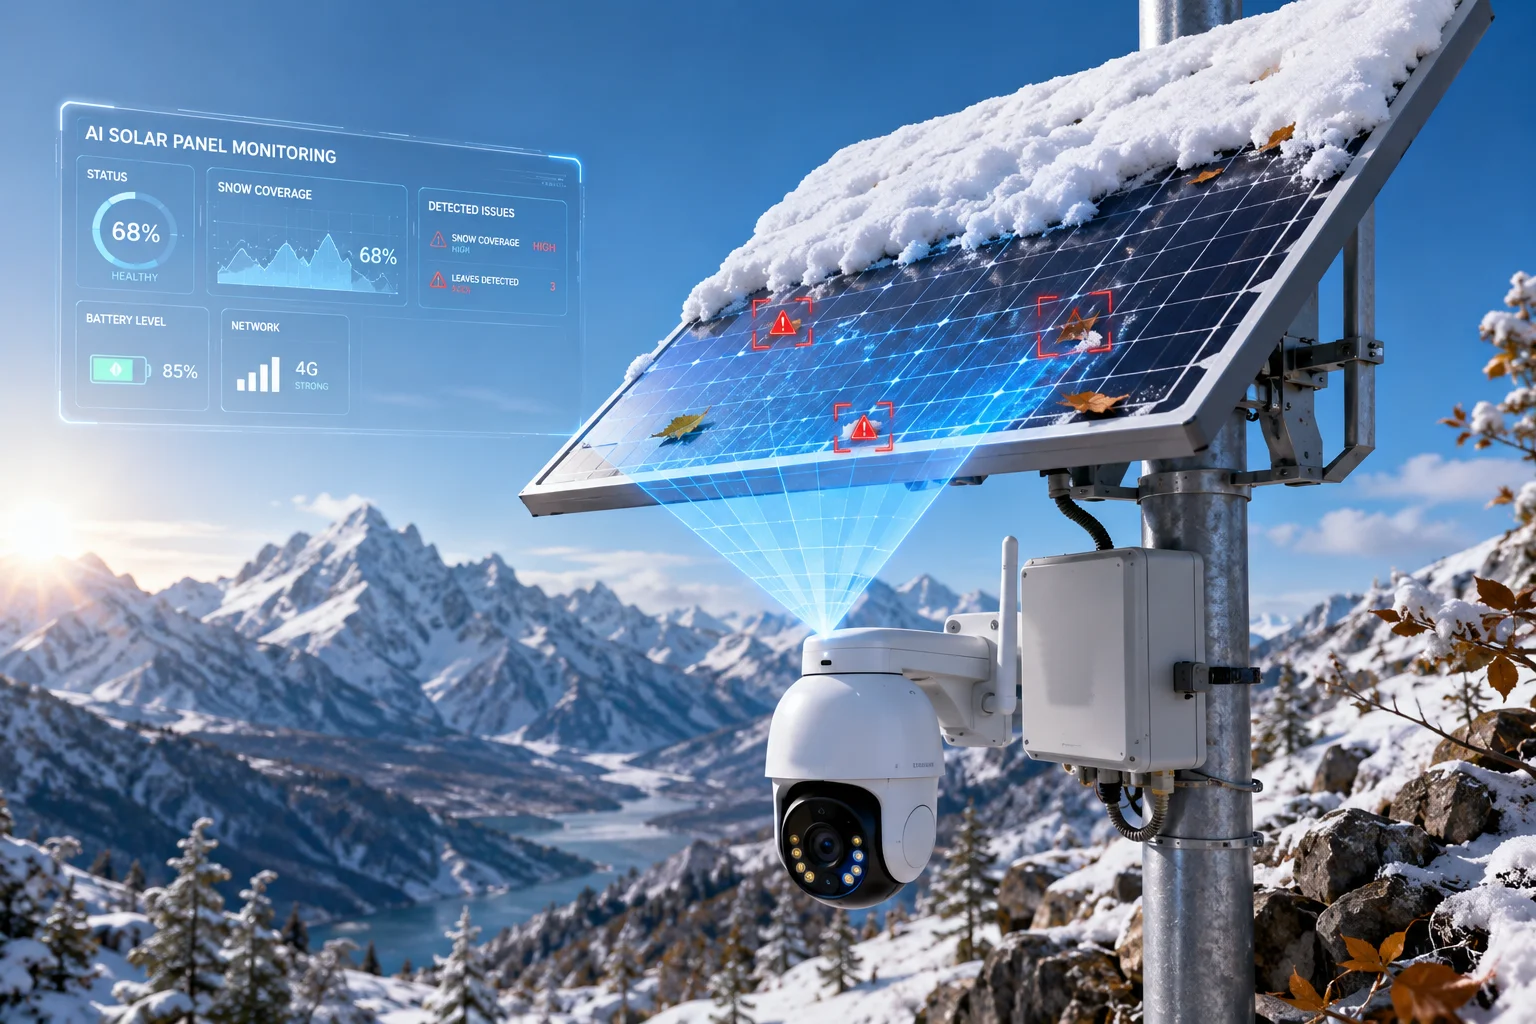 solar panel blockage AI monitoring
I usually treat this as a practical warning layer, not a single magic feature. The best setup checks both the electrical side and the visual side. That is what makes the alert useful for real B2B projects, especially in off-grid 4G solar systems3 where a missed issue can stop the whole site.
Table of Contents
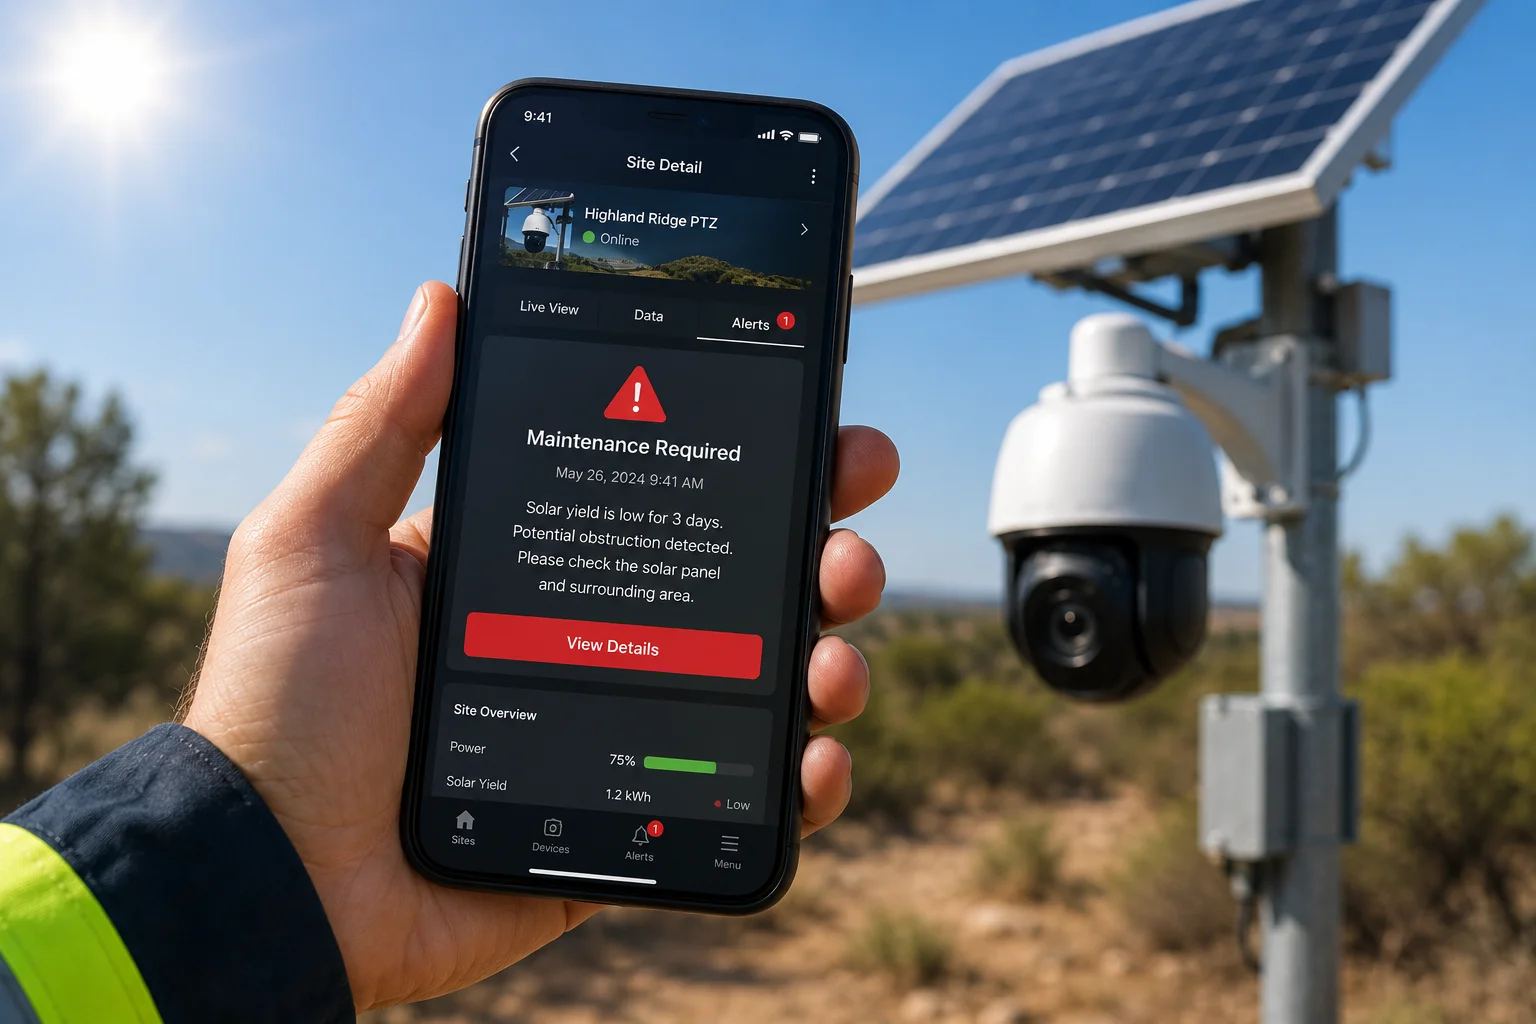
Will the app send a “Maintenance Required” push if the panel’s yield drops due to obstruction?
I have seen this happen in the field, and the answer is yes if the app is built the right way. The key is not just watching one number. I need the system to compare solar yield, light level, and time of day before it decides that the panel is blocked.
If the panel output drops hard while the scene still shows strong sunlight, the app should send a “Maintenance Required” push. That alert can be based on low charging current, a long flat power curve, or a big gap between expected and real output. This is much better than waiting for the battery to die and the camera to go offline.
 maintenance required solar alert
When I design this kind of alert logic, I look at the whole chain. The app should not cry wolf on a cloudy morning. It should check the MPPT data4, the battery state5, and the scene light from the camera. If those signals disagree for a long time, I treat that as a strong sign of blockage. I also like a simple alert ladder. A small drop can mean dust. A deep and lasting drop can mean snow, leaves, or other full cover. That gives the installer a clear action path. For David Miller and other technical buyers, this matters because it cuts truck rolls6. It also helps him explain to his customer why the system is warning early instead of waiting for a failure. In a remote job site, early notice is worth more than a fancy dashboard.
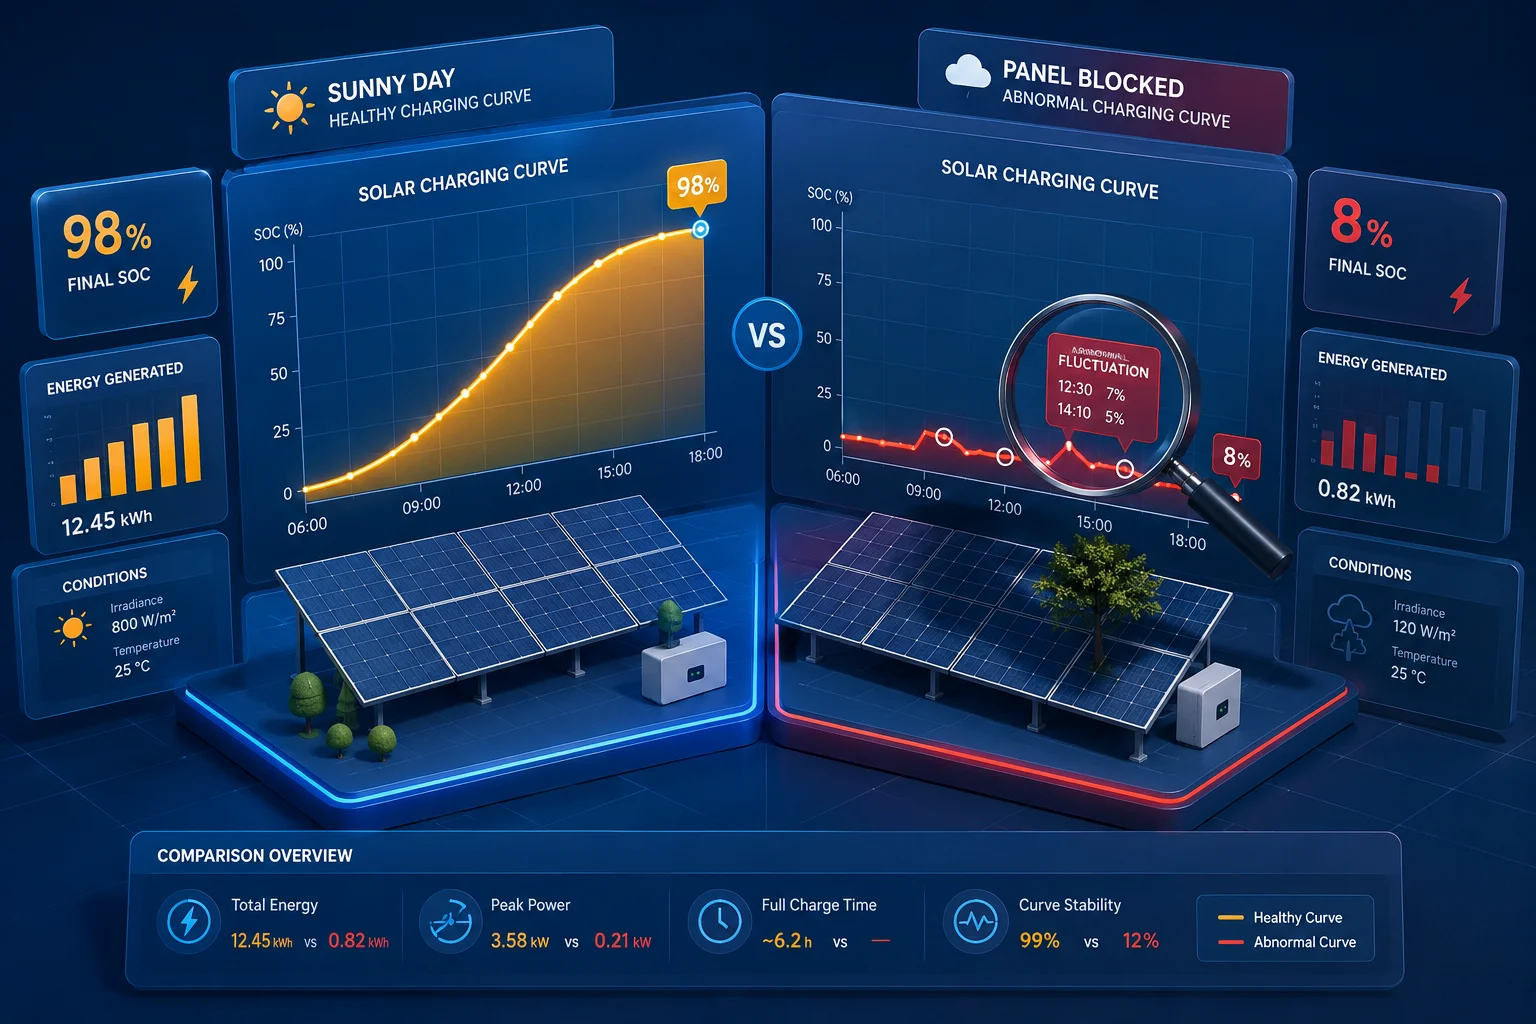
Does the algorithm analyze the charging curve to distinguish between a cloudy day and a dirty panel?
I rely on charging curve analysis7 for this job because it gives me a real clue about what the panel is doing over time. A dirty panel and a cloudy day can both reduce output, but they often do not look the same in the data. A cloudy day usually causes smoother changes. A dirty or blocked panel often causes a strange flat line, a weak peak, or sharp drops that do not match the light level.
The app should watch the charging curve across the day, not just at one moment. If the light rises but the charging power stays weak, I would suspect dirt, snow, or leaves. If the power swings up and down in a rough pattern, I would check for partial shade8 or local blockage. This helps me avoid false alarms and gives the user a better reason for the alert.
What I look for in the curve
| Pattern | Likely meaning | My action |
|---|---|---|
| Smooth drop with lower light | Cloudy weather | No urgent alert |
| Flat low output with bright scene | Possible blockage | Send warning |
| Sharp spikes and dips | Partial shade or leaves | Check panel area |
| Long near-zero output in daylight | Snow cover or full blockage | Send maintenance push |
 charging curve analysis solar panel
I also think history matters a lot. A single day of low output is not enough. I want the system to compare the current curve with yesterday, last week, and the same season if possible. That makes the judgment much stronger. For example, if the panel always performs well at noon in clear weather, and one day it suddenly stays weak while the sky is bright, the app has a good reason to raise the alarm. In my view, the best algorithm is simple but careful. It should use thresholds, time windows, and trend checks. It should not depend on one hard rule only. That is how I would build a system for a customer who wants stable field work and fewer false service calls.
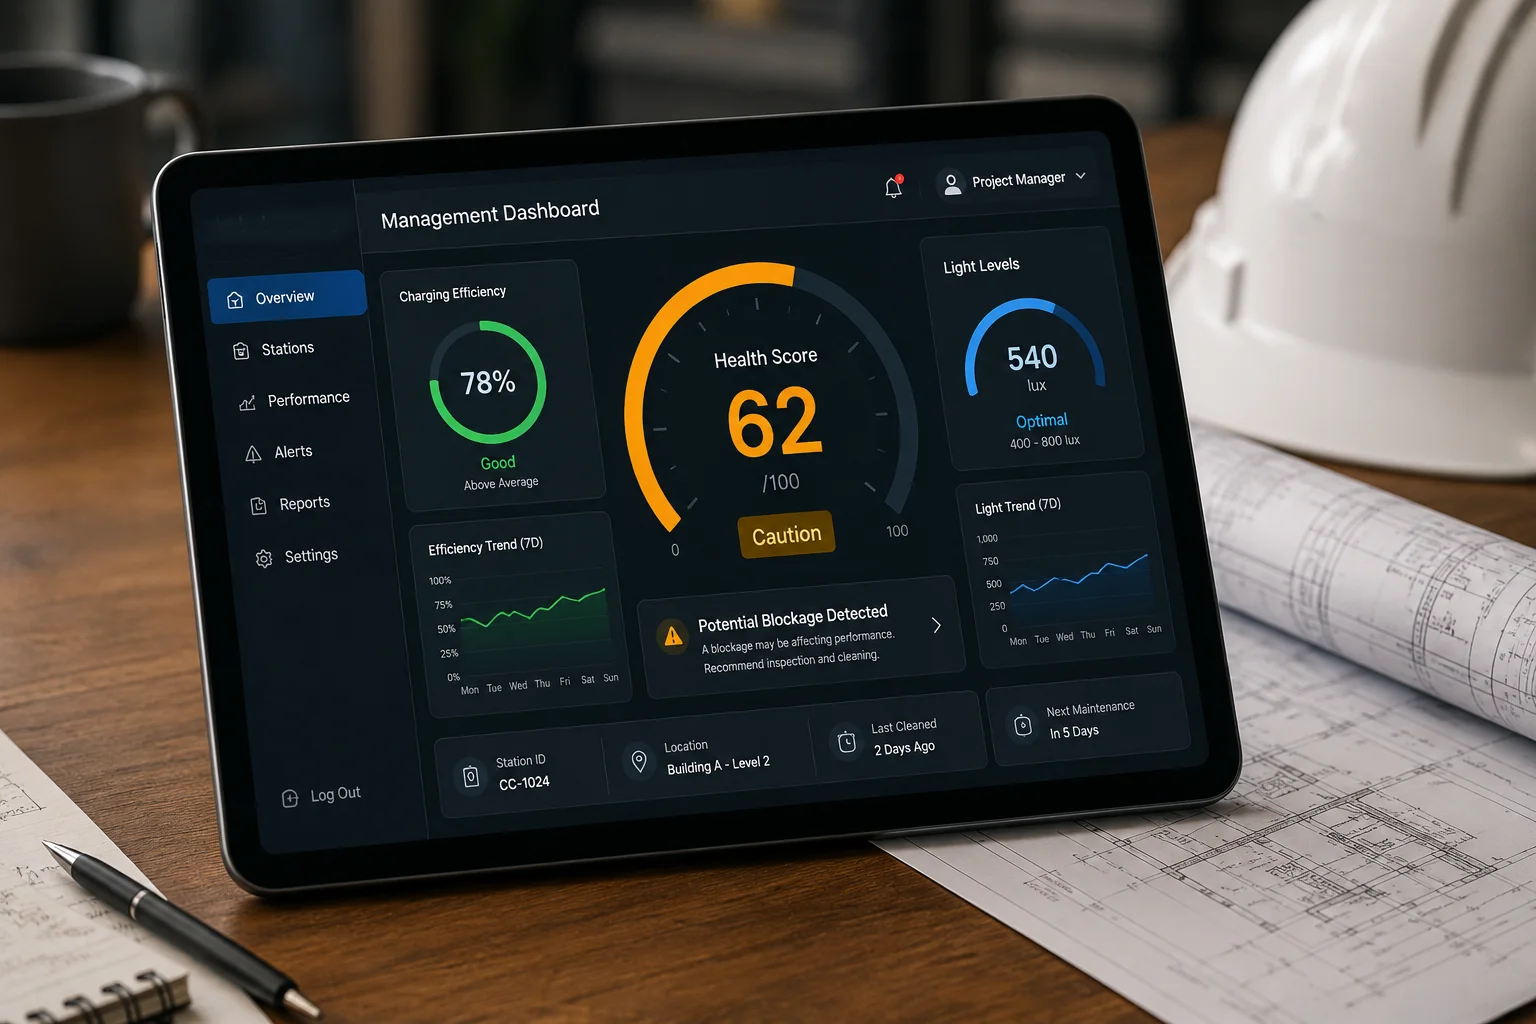
Can I see a “Health Score” for my solar panel’s cleanliness on the dashboard?
I like this idea because a simple score is easy for installers and end users to understand. A cleanliness score turns complex data into one clear number. If the score is high, the panel is likely clean and working well. If the score drops, I know I need to inspect the panel or plan service.
On the dashboard, I would want this score to combine several signals. I would use charging efficiency, light conditions, output stability, and maybe image clues if the camera can see the panel. I would not use one factor alone, because one factor can lie. For example, a cloudy day can make a panel look weak, but that does not mean the panel is dirty. A good health score should be smart enough to separate weather from real cleanliness issues.
A simple dashboard model
| Score range | Meaning | Suggested action |
|---|---|---|
| 90-100 | Panel looks clean | No action |
| 70-89 | Small loss | Watch it |
| 50-69 | Possible dirt or leaves | Plan cleaning |
| Below 50 | Strong blockage risk | Send service alert |
I also think the score should be easy to explain to customers. David Miller does not want a vague chart with no meaning. He wants a score that supports fast field action. If the dashboard shows 62, he should know that the panel is not failing yet, but it is losing value. That helps him plan a maintenance visit before the system fails in the middle of a remote project. I would also add a short reason line under the score, such as “low output with strong light” or “visual cover detected.” That makes the tool more useful. It gives the user a fast answer, not just a number.
Will the camera trigger a “Self-Cleaning” vibration (if equipped) when it detects a blockage?
I think this is a smart idea for special systems, but I also think it needs careful rules. A self-cleaning vibration9 can help shake off light dust, small leaves, or loose snow. But it should not start too often. If it runs too much, it can waste power or annoy the site owner. So I would only trigger it when the blockage looks light and the system has enough battery power.
If the camera or control system detects a small blockage, it can send a command to the vibration unit. That command can come from the AI logic after it checks the scene and the charging data. If the issue is heavy snow or a large pile of leaves, vibration alone may not solve it. In that case, the system should send a maintenance alert instead. I see this as an automatic first response, not a full fix.
 self cleaning vibration solar panel
When I would allow self-cleaning
| Condition | Vibration trigger? | Why |
|---|---|---|
| Light dust | Yes | Low risk, may help recovery |
| Small leaf cover | Yes | Loose debris may fall off |
| Heavy snow | No | Too much load, needs manual service |
| Battery very low | No | Save power for core work |
| Repeated blockage | No | Better to send a technician |
I also like the idea of linking this function to a clear rule set. The system can first check battery reserve, then confirm low output, then look at the visual scene, and only then trigger the vibration. That keeps the feature safe and useful. For remote solar camera projects10, this matters because the whole point is to stay online with as little human work as possible. A self-cleaning feature can reduce downtime, but I would still keep human review in the loop. That way the system stays smart, but it does not act blindly.
Conclusion
I believe AI can detect snow or leaf blockage well when it uses both electrical data and visual checks. For remote solar projects, that kind of alert can protect uptime and reduce service cost.
1. Understand how AI is applied to detect patterns and anomalies in solar panel performance. ↩︎ 2. Learn how combining multiple data sources improves detection accuracy. ↩︎ 3. Overview of off-grid solar systems with 4G connectivity for remote monitoring. ↩︎ 4. Maximum Power Point Tracking data helps assess solar panel efficiency under varying conditions. ↩︎ 5. Learn how battery state of charge impacts system operation and maintenance alerts. ↩︎ 6. Explanation of truck rolls and how predictive maintenance reduces them. ↩︎ 7. Detailed guide on interpreting charging curves to distinguish between weather and blockage. ↩︎ 8. How partial shade affects solar panel output and how to detect it. ↩︎ 9. Article on self-cleaning technologies for solar panels, including vibration methods. ↩︎ 10. Overview of solar-powered remote cameras and their maintenance challenges. ↩︎